Monday, December 15, 2008

Does It Matter Where a Senator Comes From???


Before all of the shenanigans in the Illinois Senate seat appointment emerged, there was an underlying discussion about the ability of whoever was appointed to win "statewide." With the assumption that the designee would hail from Chicago, attention immediately turned to the fact that whoever was chosen would have to run two years later for a full term. An even more daunting schedule awaits Hillary Clinton's successor as the new Senator will have to run first in 2010 for the right to fill out the term, and then in 2012 for a full 6 years.

Given that the designee will not initially gain their seat via the will of the people, there is uncertainty as to how palatable they will be to the electorate once they are on the ballot. More ethically minded governors than Rod Blagojevich need to speculate about how the new Senator will fare across a state's myriad voting groups. In the case of Illinois, should the designee come from Chicago they begin, potentially, with a large voting bloc ready to support them (or that is at least familiar to them). This would especially be the case for appointees already holding some elected office--House members, mayors, state senators, etc. Once in office, however, they will need to broaden their appeal to voters across the rest of the state.

Complicating this, sometimes, is the fact that voters "out-state" tend to receive coolly politicians from the "big city." These candidates might be perceived as arrogant, unconcerned with the needs of people from small towns or rural areas, or too ensconced in the ways of the state's dominant metropolis. Thus, "out state" voters might react against them in favor of someone more familiar. Central to Richard Fenno's theory of "home style" is the need for voters to identify with candidates in order to trust them. This tension between the big city and "out-state" has manifest itself in my home state of Wisconsin where a governor who hailed from Milwaukee hasn't been elected since the late 1920s despite the fact that the Milwaukee metropolitan area accounts for roughly 30% of the state's population. While Chicago clearly dominates Illinois' economy and is by far the population center, there is no guarantee that a Senator from there will automatically win. This question got me wondering, then, about how common it is for Senators to come from their state's largest city or metropolitan area. Is it truly an advantage or might "out state" Senators be more attractive. Thus, I decided to look at the current Senate (minus Obama) to see if one type of candidate is more prevalent.

In answering this question I would note that there are numerous caveats to raise. Many many factors, aside from residence, account for why candidates win Senate seats. Among these are their previous experience (elected offices, private sector work, etc.), the underlying partisanship of the state, the quality of their challenger, whether they are an incumbent or seeking their first term, fundraising prowess, and the political climate in which their campaign takes place. Also, we can't automatically assume that the candidate will automatically win these big city voters in a proportion greater than the norm. Further worth noting is that some states have many population centers, thus creating numerous "big city" vs. "out state" dynamics. California comes immediately to mind with L.A., San Francisco, and San Diego acting as population meccas; Texas and Florida might also be cited. Thus, this analysis, and any conclusions we might draw, will be crude at best. Nonetheless, what do we see.

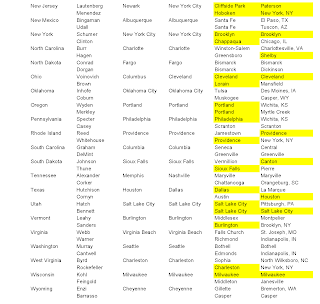
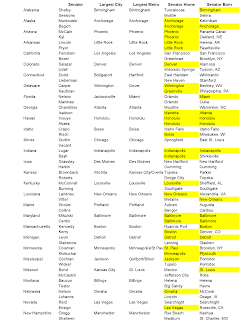
Above I've produced a simple spreadsheet that shows each state's two Senators followed by the state's largest city and metropolitan area. I included both city and metro areas because of the possibility that the suburban spread of one city might make it larger than that of the state's largest city proper. Because metro areas share common media a candidate might be able to take advantage of this to attract a large voter base. I also included metro areas because in some states the largest metro area is in fact a cluster of suburbs to a city in a neighboring state--New Jersey being the obvious example here. Next I've listed both the residence and city of birth for the Senator. While we see that many Senators reside in the same places in which they were born, Senators will also try to identify both their residence's and birthplace's voters as their own. Should there be a match between either the Senator's residence or birthplace and either the state's largest city or metro area, I've highlighted the correlation.

As a bit of trivia, I'd note that Brooklyn seems to be a great place to be born if you aspire to represent a state other than New York in the Senate, as Barbara Boxer (CA), Bernie Sanders (VT), and Norm Coleman (MN) all hail from there.

Overall, we see that for just barely a majority of Senate seats--52--does the incumbent Senator come from their state's population center. Thus, there doesn't seem to be, on its face, much of an advantage from coming from the area with the most votes. Candidates seem to be able to emerge from a variety of places within a state--some from big cities, some from tiny hamlets. One thing that might be worth exploring--which I didn't calculate--is whether the size of the biggest city vis a vis the rest of the state--matters. If the biggest city in a state is comparatively small the advantage accrued by winning those votes is less that if the state's biggest city is proportionally much larger.

I'd be happy to entertain any other theories or observations that anyone has about how meaningful the "big city" vs. "out-state" dynamic is.

Tuesday, December 09, 2008

Saul Anuzis to GOP Economic Populists: "This is not your average Republican twitter page!"

ElectionDissection strolled down to the offices of Americans for Tax Reform for the latest in the series of Newsmaker Breakfasts hosted by the American Spectator.  The “newsmaker” on hand was Saul Anuzis, the Michigan Republican Party chairman who earned the Paultards’ enduring animus by calling for Ron Paul’s exclusion from Republican presidential primary season debates after his symbiotically beneficial contretemps over 9/11 blowback with fmr. NYC Mayor Rudy Giuliani in South Carolina.

Despite the fact that its Congressional delegation has been shrinking in recent rounds of redistricting and expects to at the next census, Michigan’s noteworthy political legacy is even more salient as potential bailouts for the Big Three dominate the headlines.  It’s clear that Anuzis’ decades of experience in the trenches of Wolverine State politics do color his vision for a revivified GOP as he vies for RNC Chair.

Anuzis highlighted his vision for harnessing new media to facilitate disseminating the GOP’s message.  (Best line: “This is not your average Republican twitter page!” Oxymoron of the week: “Republican twitter page!”)  And he repeatedly harkened back to the fabled “Reagan Democrat,” citing appealing to this once-decisive voting bloc as the key to a Republican resurgence.  Suburban Detroit’s Macomb County boomed in the 1950s and 60s with auto workers as White Flight emptied the white working class neighborhoods of Detroit’s Wayne County.  Democratic pollster Stanley Greenberg identified Macomb as the spiritual home of this famously crucial electoral demographic.  (It’s interesting to note that Greenberg, post-2008, agrees that this political dinosaur is, in fact, extinct.)   

“Reagan Democrats,” of course were those Northern, often-ethnic and heavily Catholic, white working class voters who were lured away from their ancestral Democratic moorings by GOP appeals to their conservative opinions on moral issues, busing and crime and Cold War hawkishness.  But many of these voters were proud union men (and women) who couldn’t swallow even Ronald Reagan’s free trade agenda.  This was especially acute in Macomb Co., Michigan in the 1980’s as competition from Japanese imports rattled Detroit’s long-term game plan.

While social conservatism can be found in Michigan politicians of both parties – Reps. Dale Kildee, Bart Stupak and John Dingell count themselves as either pro-life, pro-gun or both – so, too, does the state’s formidable strain of economic populism infect voters on both sides of the aisle. 

Alabama’s segregationist governor George Wallace first identified this political animal instinctively, scoring above his national average in Macomb in his 1968 indie bid, and capturing a majority in the 1972 Democratic presidential primary statewide.  Twenty years later, Pat Buchanan barnstormed the state denouncing imports and racked up his best score this side of the Granite State in his challenge to George H.W. Bush’s renomination.  Four years later, he fared even better, denouncing NAFTA at every stop. 

Only an underwhelming performance in Detroit dragged Ross Perot’s percentage statewide back to his national average in 1992.  In over half of Michigan’s counties, his call to heed that “giant sucking sound” supposedly sending manufacturing jobs to Mexico pulled in over a quarter to 30% of the vote.

And in this year’s Republican presidential primary, Mike Huckabee scored well in Dutch-settled southwestern Michigan where his social conservatism no doubt resonated with the Calvinist Dutch Reformed Church-goers.  But, his economic populism seems to have struck a cord here, too.  The area’s Dutch-American U.S. Rep. Peter Hoekstra was the only Michigander Republican to oppose NAFTA back in ’93.  Huckabee’s populist notes also played among Yoopers, too, in the Upper Peninsula’s mining and timber towns. 

But Michigan’s stunted population growth has frozen the smaller, broken rust belt cities like Saginaw, Flint, Muskegon and Bay City, where Wallace, Buchanan and Perot exploited white working class anxiety, as well as both the U.P. and the Dutch southwest where Huckabee found a base far above the Mason-Dixon Line. 

Macomb is growing, but still totals far behind Oakland’s population.  (Besides, Obama captured the county comfortably, flipping the narrow win G.W. eked out in 2004.)  Contrast Macomb to its fellow Detroit suburb, Oakland County.  Once home to Midwestern, Michigan, Gerald Ford-style regular Republicans, as this affluent and educated enclave population expands, it threatens to surpass Detroit’s Wayne County, which still continues to hemmorage residents, as the state’s largest jurisdiction.  Oakland’s Democratic trend is relentless as Obama scored the best Dem numbers since LBJ, beating FDR, even!  McCain’s percentage dipped to near Goldwater and Alf Landon lows.  Once safe GOP Rep. Joe Knollenberg also succumbed to Oakland's Democratic wave in '08, after what shouldn't have been a surprisingly close race in '06, given the county's trends were then becoming evident.  (Note, too, the strong showing by North Dakota Rep. William Lemke’s third party bid here in 1936, whose message melding social conservatism and economic populism was amplified by on air harangues from Father Coughlin, the anti-Semitic radio priest whose Shrine of the Little Flower sits in now-trendy Royal Oak, a leading indicator of Oakland’s partisan progression.  Royal Oak gave Gore a 51-45 win over Bush in 2000.  By 2008, Obama’s margin here had grown to a lopsided 61-37.)

Building on a question from Economist.com blogger Dave Weigel suggesting the GOP's appeals to socially conservative voters and anti-immigrant demagoguing had aliented electorates in similar suburban counties nationwide, ElectionDissection questioned Anuzis about whether his strategy for staving off further losses in Oakland included toning down the economic populism that hasn't been a vote-winner there – especially in light of a Big Three bailout that may play well in his state, but not among the Southern-anchored grassroots of the party he wants lead - his answer focused more on this blog’s analysis of Michigan’s political geography than his thoughts on recasting the Republican message.  But Anuzis did offer some interesting off-the-cuff insight into shifting intra-state demographics – UAW retirees, for instance, migrating up north to retire and the increasingly racially diverse make-up of Oakland Co.’s electorate – which offer fodder for future posts.  

Monday, December 08, 2008

The Twin Cities' Suburbs and Obama's (Lack of) Coattails


To get a sense of why they're still counting votes in the Minnesota Senate race, the above maps might be instructive. Obviously, Obama's support was more widespread than Al Franken's. Initially, I thought the reason Franken wasn't able to capitalize on Obama's big win was due to underperformance in Ramsey County (St. Paul). Being Norm Coleman's home--he was Mayor of St. Paul prior to running for the Senate--this wouldn't be surprising.

When one compares the candidates' performance in both Ramsey and neighboring Hennepin County, however, another explanation seems more plausible. In looking at the countywide vote, Franken actually did better in Ramsey than Hennepin. The third party candidate in the race, Dean Barkley, performed about equally well in each county, receiving 15.5% in Ramsey and 14.7% in Hennepin. Franken, while winning both counties quite handily received 51.1%in Ramsey compared to 49.3% in Hennepin. Coleman thus took 33.3% in Ramsey and 35.7% in Hennepin.

In comparing the maps one sees a noticeable strength for Coleman in the western and southern Minneapolis suburbs, still part of Hennepin County. Whereas Obama was able to win in a number of these outer precincts, Franken fell short.

This split ticket voting was evident not only in the Senate race. Going into November 4th, Democrats were hoping to pick up the open House seat being vacated by moderate Republican incumbent Jim Ramstad in the 3rd District. On election day, however, Republicans were able to hold the seat with the election of state legislator Erik Paulsen. Whereas Obama won the 3rd district with 53% of the vote, Paulsen scored an 8 point victory over Democratic nominee Ashwin Madia.

This dynamic was not confined to the Twin Cities. In a number of suburban areas, sizable Obama wins did not necessarily translate into Democratic congressional pickups. For example, in a similar type of race, moderate Republican Rep. Mark Kirk was able to hold onto his suburban Chicago seat despite the fact that it went for Obama.

**Maps courtesy of Minnesota Secretary of State

Does It Take Two Hurricanes Plus an Indictment to Elect a Republican in New Orleans???

Louisiana has to have some of the most interesting, yet oftentimes confusing, politics in the country. And since the devastation, and demographic chaos unleashed by Hurricane Katrina, Bayou politics has become more unpredictable. The most recent evidence of this came about Saturday as a result of the congressional election in the 2nd district that saw the defeat of long embattled (and indicted), yet long tenured Congressman William Jefferson. The result of the election was the ascent of the first ever Vietnamese-American to Congress, Republican Anh "Joseph" Cao. How we got to this piece of history takes a little explaining.

The arrival of Hurricane Gustav this August essentially pushed back each election for the seat. November 4th was actually the primary, which Jefferson won in the overwhelmingly Democratic district. With the primary completed, the general election was thus held on Saturday. However, as we know, elections held after the general are fraught with both unpredictability and low-turnout (witness last week's Georgia Senate run-off). While Jefferson's indictment, one would think, would be responsible for his defeat, other factors are likely bigger factors. First, as the coverage of the election makes pretty clear (good number breakdown here), turnout among African Americans--the largest group and backbone of the district--was very low. While low turnout among a candidate's base might be enough to spell their demise, Jefferson's difficulties were exacerbated by another Hurricane--Katrina. In my look at HBCU voting last week (see post here) I examined the vote in a number of southern counties. As we would have expected, the total number of votes in these high African American vote counties greatly exceeded what we saw in 2004. In Orleans Parish, however, the opposite happened. Because of the massive out-migration and displacement among African Americans caused by Katrina, 50,000 fewer votes were cast this year than in 2004. Thus, Jefferson found himself faced with an unfavorable environment:

Fewer Total Democratic Voters + Low Turnout + Indictment = TROUBLE

Throw in the fact that Cao has an incredibly compelling story and you have Saturday's result. While people are already doubting the ability of a Republican to hold this district in a more "normal" election year like 2010 (running against someone not under federal indictment), such jockeying for the seat can wait for a while in light of the history this election made.

Friday, December 05, 2008

Indian Republican or Republican Indian? Slurpees or Casinos?


Savvy flaks in the Party of Lincoln are perpetually mindful of their historic paucity of even passably plausible minority public faces.  And, in the midst of the GOP’s post-drubbing soul searching, former Maryland Lt. Gov. – and famously failed Senate nominee – Michael Steele has stepped forward, offering himself as a reform-minded candidate of color for RNC chairman, differentiating himself from the white guys in suits/Republican Regular types who usually vie for the post. 

However, after the smoke cleared from the recent round of internecine squabbling among what’s left of the congressional Republican rump before the 111th Congress convenes, one more of those public faces has fallen by the wayside. 

Only those who follow this sort of insider skullduggery took note that when Rep. Tom Cole (Okla.) withdrew in the face of a seemingly overwhelming challenge to topple him from the head of NRCC, the House GOP campaign arm, Republican leadership lost it’s only American Indian.  Critics hounded Cole as the GOP lost previously safe seats in special elections - including shockers in rural Mississippi and fmr. Speaker Denny Hastert’s in once-rockribbed Republican Illinois – and blamed him for failing to stanch House GOP losses in November.  Tension lingered between Cole and House Minority Leader Boehner.  So, Cole’s distinctive ancestry (at least in these circles) seemed to be the last thing on Members’ minds.  

Much more attention has been lavished on Lousiana Gov. Bobby Jindal.  The Subcontinental Indian descended chief executive of a state that nearly elected a former Grand Wizard as recently as the 1990’s, is repeatedly dubbed a "GOP rising star" in the press. 

With Cole on the way out and the Jindal on the way up, it’s hard to escape hearing Lisa Lampanelli, the “Queen of Mean,” bark out her witty update on the old stereotype, “dot or feathers,” in 2005’s dirty joke biopic, “the Aristocrats.”  The GOP’s new direction?  “Slurpees not Casinos!”       

Wednesday, December 03, 2008

The Black Student Vote and Barack Obama

Last week I came across this article about Obama’s win in North Carolina. Mentioned at the end is the claim that Obama’s win can be partially explained by increased turnout not just among African American voters, but especially students at Historically Black Colleges and Universities (HBCU's). The Tarheel State has 11 HBCUs. This got me thinking about the role of this student group across the country and whether or not we can point to any clear gains made by the Obama camp as a result of this energized student base. Also bolstering my interest in this question was the fact that last weekend saw the playing of the annual Bayou Classic in New Orleans, one of my favorite sporting events of the year to watch. If you don’t think the Obama win was important to the student bodies of Southern and Grambling State Universities, check out the halftime performance of the “Battle of the Bands”—in many ways a more passionate and heated contest than the football game itself (Southern here, Grambling State here).

Thus, I decided to build a database of voting across the HBCU universe and do some number crunching. The database has been posted here (Google account required) along with the explanatory key for each column.

HBCU’s were created, beginning in the aftermath of the Civil War, to allow African Americans access to higher education. The vast majority of these schools are located in states of the Deep South, which isn’t surprising given the degree to which blacks were excluded from college enrollment in these states’ flagship universities. Thus, HBCU’s have for decades acted as the route to the professions for many of the country’s black students. Currently, about 14% of all African Americans in college attend an HBCU and about 25% of the bachelor’s degrees awarded to African Americans come from one of these schools. Over time, several HBCU’s have not only welcomed non-black students but have become predominantly white or other minority. The University of Texas El Paso, for example, is now over 70% Hispanic. This school, formerly known as Texas Western, has an important place in collegiate athletics and HBCU history in that its 1966 national championship men’s basketball team was the first to start 5 black players (against the all white University of Kentucky dynasty). Thus, their role not only in educating the black community, but the nation as a whole, has been vital.

There are currently 103 HBCU’s across the country, located in 22 states and 76 counties. Only a small handful are outside of what we would consider “the South”—Lewis College of Business in Detroit; Cheyney and Lincoln Universities in Pennsylvania; Charles Drew University of Medicine and Science in Los Angeles are examples. Alabama is the state with the most HBCU’s—14. Next among the states with many such schools are North Carolina (11), Georgia and Texas (9), and Mississippi and South Carolina (8). Another thing one notices, and which is included in the database, is the diversity in the size of each of these schools. Some have only a few hundred students while others are quite large—Howard University, Florida A&M, Texas Southern, and Southern University are among the largest. Overall, however, in looking at enrollment size, it doesn’t seem as if these schools—within their respective counties—provide enough votes to truly sway an election.

When we look at how each of these schools’ counties voted this year—and compare this year’s race to 2004’s--what do we see? First, Barack Obama won 52 of the 76 counties in which HBCU’s are located. While on the surface this might have been useful for Obama in capturing several states, the reality is that many of these wins took place in states that went solidly for McCain. For example, as mentioned Alabama contains 14 HBCU’s yet was won by McCain with 60%. At the county level, Obama won 3 of the 8 counties containing these schools. Likewise, in Mississippi, Obama won all 6 of the counties containing its HBCU’s and in South Carolina he won 4 of 5 HBCU counties (McCain won each state with 56% and 54% respectively). This fact, it seems, illustrates a much larger point not only about the history of the HBCU movement but about America’s complicated political history.

In numerous posts over the past year or so I’ve dwelled upon the debate about white vs. black voting in the Deep South. What we’ve seen, through not only exit polling, but also simple geography and demographics, is that there has been a clear divide between black and white voters in the region. For example, most of these HBCU’s are physically located in counties that have very sizable black populations. 58 of the 103 HBCU’s reside in counties that are at least 30% African-American. Thus, it would seem as if the decision about where to locate these schools was very deliberate. Because these schools in many cases served a population that was underserved and lacking in resources it made sense to have them close to where the student body would hail from. Also, one wonders how successful these schools would have been (or even if they could have been created) had they been located in overwhelmingly white areas. For example, only one HBCU (Clinton Junior College in Rock Hill, SC) is located in a county that is less than 20% black in the Deep South states of South Carolina, Georgia, Alabama, Mississippi, or Louisiana. Worth remembering is the degree to which the residence of the black population in the South (as seen across counties) has been remarkably stable. Thus, returning to the vote this year, it seems as if the Obama vote we see at the county level is not so much a result of these schools bringing political change to an area, but rather amplifying the underlying preferences that have always been there. Obama’s candidacy energized this underlying Democratic allegiance and gave it reason to turn out in greater force than it had in years past.

When we compare this year’s vote to 2004, while we do see evidence of change, some of it seems due to other factors. Whereas Obama won 52 of the 76 HBCU counties, John Kerry managed to win only 39. Obama’s improvement on Kerry’s number took place across 8 states, flipping three counties in North Carolina (Cumberland, Forsyth, and Wake); 2 in Louisiana (East Baton Rouge and Caddo) and Texas (Dallas and Harris); and one each in Alabama (Jefferson), Delaware (Kent), Florida (Leon), Georgia (Peach), Pennsylvania (Chester), and Virginia (Henrico). The Texas wins in the counties containing Dallas and Houston can be attributed to no longer having native Texan George Bush on the ballot. Likewise, the addition of Delaware’s Kent County can be tied to Joe Biden’s VP nomination. Here is a breakdown of these counties, their Obama vote %, Black % vote, and HBCU enrollment:

Jefferson AL (Birmingham) 52.6% Obama, 39.4% Black, 3000 Students
Kent DE (Dover) 55.0% Obama, 20.7% Black, 3000 Students
Leon FL (Tallahassee) 62.2% Obama, 29.1% Black, 10000 Students
Peach GA (Ft. Valley) 53.4% Obama, 45.4% Black, 2500 Students
Caddo LA (Shreveport) 51.5% Obama, 44.6% Black, 1100 Students
E. Baton Rouge LA (Baton Rouge) 51.1% Obama, 40.1% Black, 11000 Students
Cumberland NC (Fayetteville) 58.9% Obama, 36.7% Black, 4000 Students
Forsyth NC (Winston-Salem) 55.3% Obama, 25.9% Black, 2800 Students
Wake NC (Raleigh) 57.3% Obama, 19.7% Black, 4300 Students
Chester PA (Cheyney) 54.6% Obama, 6.2% Black, 2800 Students
Dallas TX (Dallas) 57.7% Obama, 20.3% Black, 700 Students
Harris TX (Houston) 50.8% Obama, 18.5% Black, 10000 Students

Henrico VA (Richmond) 56.2% Obama, 24.7% Black, 1500 Students


Of those remaining counties, the only county with both a close margin of victory for Obama and a sizable HBCU population is East Baton Rouge Parish in Louisiana. Thus, whereas Southern University may have lost the Bayou Classic on Saturday, their vote may have helped tipped their county to Obama’s side, something Grambling State wasn’t able to do in Lincoln Parish which went heavily for McCain. Whereas Leon County Florida has a big HBCU population (Florida A&M) it was quite lopsided in its support for Obama. The presence of Florida State University there and its big student population might explain some of the margin and could perhaps show a greater tendency of white and black students to vote in a more colorblind way. For the North Carolina county flips, we see both relatively large margins for Obama and a relatively small HBCU population.

What are some other things we see when crunching these numbers??? Overall, Obama’s performance across these counties greatly improved on that of Kerry, something McCain was not able to replicate vis a vis George Bush. Compared to 2004, the Democrats got a higher % of the vote in 72 of the 76 counties considered here. Obama only underperformed Kerry in Jefferson County Arkansas (which he still won handily), Mercer County West Virginia, and Harrison and Wood County Texas. While McCain’s county %’s versus 2004 are dismal (only gaining in the 4 Obama declined in), an even worse scenario emerges when we look at raw vote totals. Given that the size of the electorate increases over time and that this year saw higher turnout than 2004, one would assume that both McCain and Obama would get more votes in each county than Bush and Kerry did respectively. Not so. Whereas Obama got more votes than Kerry in 70 of 76 counties, McCain only got more votes than Bush in 31 of the 76!!!! And remember, we’re mostly talking about the Deep South here. When you compare the improvements that Obama made with these declines suffered by McCain, you see how Obama was able to turn some areas from red to blue. Here, North Carolina jumps out.
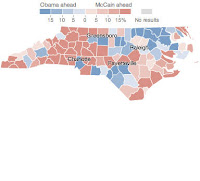
Obama won North Carolina by 14,177 votes. In the HBCU database, we saw how Obama flipped Cumberland, Forsyth, and Wake County. Looking at the net vote gains (Democratic gains in 2008 over 2004 minus Republican gains in 2008 over 2004) in these three counties, Obama had a net increase of 126,563 votes. That’s your win right there. If you take other strong Obama counties in the state included here—Mecklenburg (Charlotte),
Guilford (Greensboro), and Durham (Durham)—you add an additional 162,154 votes!!! That’s nearly 290,000 votes gained in just 6 counties. Not only did Obama vastly overperform in North Carolina, McCain didn't even break even with past Republican showings. That is a sure fire way to lose.

Another state that I thought might show a similar dynamic was Virginia. Overall Obama had a 234,527 vote cushion. In the database here, there are 3 counties with an HBCU (Brunswick, Henrico, and Prince George) plus Hampton and Norfolk cities which are not part of a county jurisdiction. When you add up the net gains made by the Democrats one sees that Obama had a 70,928 vote advantage. Thus, while the Democrats increased their performance against the Republicans vis a vis 2004 in these counties, they had to rely on other counties, especially in northern Virginia to put them over the top. I should be clear that in neither North Carolina nor Virginia do I suggest that the HBCU presence and student vote were the reason these states switched from red to blue. I’d make the same caveat about the county level results as well. Rather, using this lens through which to view the election returns allows us to pick up on things we may otherwise have missed.

By focusing on HBCU’s, the data shows that we are for the most part looking at counties that are southern, black, and consistently Democratic. The Obama campaign and the 2008 election seem to have energized this electorate and given them the opportunity to elect the country’s first black president. Given the politics of the states in which most of these schools exist, we didn’t see the Obama campaign rack up massive numbers of electoral votes. States like Alabama, Mississippi, Louisiana, and South Carolina were never really in serious danger. Most of the gains made by the Democrats in these states and elsewhere seem attributable just as much to Republicans staying home as new Democrats turning out. In those states that did switch (North Carolina and Virginia) other factors surely contributed to the gains—greater white support for Obama, the economic crisis, etc. The HBCU’s, in short, didn’t make Barack Obama our next president. Nevertheless, beyond the more academic exercise of crunching election returns by using HBCU’s as a prime variable, one can’t deny the meaning that this election had to these schools’ students. If you don’t believe that, watch this.
Tuesday, December 02, 2008

Georgia Sen Runoff: Could it have been "Peach-ier" for Vernon Jones than Jim Martin?

Most press previews of today’s Georgia Senate runoff focus on how the result is expected to hinge on Afro-Am turnout.  Black voters were believed to have boosted overall turnout by over 600K this year and sliced McCain’s margin over Obama by ten points as compared to Bush’s 2004 margin over John Kerry.  And conservative white Democrats are believed to have returned to the fold down ballot after going for the McCain-Palin ticket for president.  (No wonder that the GOP has sent in Sarah Palin to rally the base in this expected low turnout runoff.) 

Performance doesn’t seem to be too far off, geographically-speaking.

Here’s the map of county returns for president:

County Map

 And here’s the Senate county map

Note Mitchell County’s tie!):

 County Map

 Given this playing field, it’s difficult not to speculate how this race might be panning out if Dem nominee Jim Martin, a fmr. State rep. and failed Lt. Gov. nominee, had fallen to DeKalb Co. CEO Vernon Jones in the primary.  Jones’ bid might have been fatally wounded by ethics questions, but given his moderate – and even conservative – views on some issues and his geographic base, Jones might have been an ideal candidate.  In fact, Jones has flirted with Republicans: donating to the Georgia Republican Party and confessing to voting for George W. Bush, twice, all the while hectoring Martin for being insufficiently pro-Obama.   

Jones’ controversial temperament seems to have stunted his growth into a politician in the mold pioneered by Black Caucus Blue Dog Georgia House Democrats Sanford Bishop and David Scott, who have built up a support in white rural Georgia – the heart of Lester Maddox country! – by staking out conservative positions on issues such as gun control and positioning themselves as guardians of local and ag interests – particularly peanuts, in Bishop’s case.

Jones would differ significantly in that he would be the first politician to carve such a support base out of a booming New South county like DeKalb.  DeKalb is now majority Afro-Am, but continues to be fairly affluent even as its residents’ hues have changed.  Despite being home to the notorious giant bas-relief memorial to Confederate generals in Stone Mountain, DeKalb was a rare oasis of support for Richard Nixon, as George Wallace swept the Peach State in 1968.

While Bishop or Scott might be secretly harboring questions of how they might have been better positioned in this post-Obama runoff, Jones might be wondering - if he had crafted a more careful career – how he might have been able to cobble together an energized black Georgia electorate with just enough of a sliver of suburban Atlanta McCain voters still disaffected with the Bush Administration and Saxby Chambliss’ Congressional Republican cohorts to pull off a victory that might be just beyond the reach of the Democratic nominee, Jim Martin. 

Tuesday, November 25, 2008

County Flips, the Rural Vote, and Changes Out West


During the primary season, I came across the great site Daily Yonder which focuses on rural politics, economics, and society. The site is on outgrowth of the Center for Rural Strategies. In the aftermath of the election, Tim Murphy and Bill Bishop put together the above map that shows the counties that switched their vote between 2004 and 2008. The provide analysis here and here. While Obama's strength was certainly in the urban cores of the country, he did improve upon Kerry's performance in rural counties. Looking at the counties that flipped this year, the midwest was clearly Obama's strength. While his Illinois performance is unsurprising, the Wisconsin changes jumped out at me immediately after November 4 (see earlier post here). Also, as we know, Indiana (post here) and Iowa changed hands this year helping Obama solidify the entire region. I'm curious about the Democratic gains that took place in the string of counties running along the Minnesota/Dakotas borders. Finally, I'd note the Democrats' improved performance in the mountain west, a dynamic that has gotten a lot of play this year. A couple of points about the mountain west:

  • Beyond the pickup of Colorado and New Mexico on the presidential level, Democrats gained Senate seats in both states.
  • Democrats gained 5 seats in the House (2 in New Mexico, and 1 each in Idaho, Colorado, and Arizona). Democrats now have a majority in the House delegations of AZ, CO, and NM and split evenly with Republicans the Idaho delegation.
  • Obama actually won Salt Lake County, Utah. While Utah's electoral votes won't change hands anytime soon, this flip was nonetheless pretty interesting.
  • Note the rural county pickups in Montana. In the end, McCain ended up winning the state by only about 12,000 votes.

Friday, November 21, 2008

Godzilla for Senate 2008!!!???

Over 125 million votes were cast in this year's election. We tend to forget, in the midst of this big number, the fact that individual human beings have made choices based on their own beliefs, ideologies, and judgments. As we crunch the numbers and look for patterns, this individuality gets lost. Rarely do individual votes make much of a difference in the outcome. However, from time to time (Florida 2000) we actually get a chance to examine more closely these individual choices. Sometimes, small numbers matter. We have another case this year in the Minnesota Senate race, now in the midst of a recount. Like in the Florida 2000 case, the intent of the voter is open to interpretation when a ballot's markings are ambiguous. Minnesota Public Radio has provided some examples of what election officials are up against. Take a look and make your own determination here. My favorite disputed ballot is the one below:


This ballot comes from Beltrami County. Located in north central Minnesota, Beltrami County has a steady history of Democratic support. This year Obama won 54% to McCain's 44%. Other than going for George W. Bush in 2000, the county has voted Democratic in every election since 1976.


Apparently, however, the choices in this year's Senate matchup were unsatisfying for this particular voter. A quick internet search doesn't find much of a history of "lizard people" running for office in these parts. I haven't done research into how easy it is for third parties to get ballot access in Minnesota either.

Does this voter want Franken? Did he initially choose Franken but then cross him out and write in "Lizard People"? Does he think all of these candidates are "Lizard People"--perhaps an astute observation about the political class? Anyhow, the margin between Franken and Coleman now stands at 136 votes. I would love to watch these ballots be argued about and potentially litigated. God help the election officials. And keep an eye on Lake Superior for any disturbances.

Wednesday, November 19, 2008

Demographic and State Shifts: Temporary Change or Realignment???


Charles Franklin of Pollster.com has created the above visual showing the performance of Obama versus Kerry across a range of demographic groups. What we see as a broad shift across virtually every group in the direction of greater Democratic support. Thus, like we saw at the state and county level, the movement toward the Democrats was quite impressive. What is no doubt the more fundamental question, however, is the duration or permanence of this shift. In the academic discussion of "realignments," what is necessary for a fundamental re-orientation of the electorate is not just movement of numerous social groups from one party to the other, but the durability of this movement. Also, with every demographic group here moving more Democratic, save three, one must wonder the degree to which the economic downturn and not other factors was ultimately responsible for the magnitude of Obama's win. Should many of these groups move back to their previous levels of partisan support over the next few years then November 4th's results won't seem so dramatic. In other words, with one election we don't have enough evidence to conclude we've had a realignment. These can only be viewed in the rear view mirror. However, much of the analysis of the exit polling that's been done over the past few weeks suggests that Democrats should be very happy about the trend lines. John Judis, who wrote "The Emerging Democratic Majority" with Ruy Teixeira discusses the possibility of this enduring majority here.


The above image of the state by state change compared to 2004 was created by Andrew Gelman at Princeton.

Tuesday, November 18, 2008

Population Stability and Polarized Voting in the Deep South


The above map, via Strange Maps, overlays the 2008 election returns(Obama counties blue, McCain counties red) with 19th century data on cotton production. The resulting image is striking. We know from exit polling that the white vote in the Deep South was strongly skewed to McCain (Whites in Mississippi, Alabama, Louisiana, Georgia, South Carolina, and North Carolina gave McCain 88%, 88%, 84%, 76%, 73%, and 64% respectively) and that the black vote was even more overwhelmingly pro-Obama. Beyond that, though, what we also see quite clearly is the degree to which the African American population in the south is largely concentrated in the same areas it was over a century ago. This is something that I noticed during the primary season as well (see posts here and here).

Thus, while the Great Migration (see post here) of the early and mid 20th century saw millions of southern blacks leave the Deep South for northern cities like Chicago, Detroit, New York, Philadelphia, and elsewhere, many millions also stayed. Also, many narratives of the Great Migration note that it was not unusual for individuals or families to return to south, either because the opportunities up north were not as bountiful as they believed or because the strong ties of family, community, and familiarity beckoned them home.

On a similar note, I highlighted recent Census data on mobility a while back (see post here). One thing that you note about several of the states in this region--especially Alabama and Mississippi--is that they have seen relatively little inward and outward movement of their populations.

Over at Pollster.com, Charles Franklin does an excellent analysis of the state by state change in Obama's support among whites vis a vis Kerry's 2004 performance. He notes not only the decline in white support for the Democratic nominee in the Deep South states, but also points out the improvement Obama made in Virginia and North Carolina. Ed Kilgore over at the Democratic Strategist also comments on this dynamic.

Thursday, November 13, 2008

The Obama Bounce Down Ballott

Yesterday's Politico has a nice article on the role of the heavy pro-Obama black turnout on a number of congressional races. Among the 20 Democratic House pickups were several propelled by the black vote. Many of these gains were in districts that have been quite Republican over the past several cycles.

What we've seen in many states' redistricting processes has been an effort to take a black population (oftentimes relatively small) and subsume it within a surrounding area that is more Republican leaning, essentially diluting the power of their votes. Under normal circumstances--i.e. black turnout significantly lower than white turnout; low levels of black mobilization; no coordinated voter registration efforts--the black vote, although heavily Democratic, isn't able to sway electoral outcomes. This year, however, was not a "normal" election year. With the Republican brand in tatters, underlying economic uncertainty, and higher black turnout, mobilization, and registration, the black vote was able to tip a number of districts. To wit:


Virginia 5. Republican incumbent Virgil Goode was defeated, by less than 1000 votes, by Democratic challenger Tom Perriello in a district that includes heavily African American "southside" Virginia. The district is 24% African American. In his past four re-elections, Goode had received 59%, 64%, 63%, and 67%.


Virginia 2. Not far from Goode, Thelma Drake got bounced by 4 points by Democratic challenger Glenn Nye. Encompassing much of the Hampton Roads area, the district is 21% African American.


Connecticut 4. Here, the last House Republican from New England, Chris Shays, was finally taken down after a series of close calls. Unlike the Virginia districts cited above, the black population in this district is only 11% (Hispanic population is 13%) and largely concentrated in the city of Bridgeport. Whereas in previous years black turnout was relatively low, this year's upturn was enough to elect challenger Jim Himes.

Ohio 1. This Cincinnati centered district saw the defeat of Rep. Steve Chabot to challenger Steve Driehaus in a constituency that is 27% black.

Maryland 1. In this House race, just recently called in the past few days, Democrat Frank Kratovil defeated Andy Harris, who defeated incumbent Rep. Wayne Gilchrest in an ugly primary earlier this year. In a district that is 11% black and was once a hotbed of support for George Wallace in his '68 and '72 presidential runs, Kratovil won by roughly 2000 votes.

Alabama 2. The retirement of incumbent Republican Terry Everett created an open seat few would normally think competitive. A Republican has held this seat since 1965. However, the 30% of the district that is African American contributed to Democrat Bobby Bright's upset win. Despite the drubbing that Obama took statewide and the exit polling that showed only 20% of white Alabamans voting for the president elect, the black vote, ironically, seems responsible for Bright's ultimate triumph.

As the article notes, most importantly, the interesting dynamic to be watched will be how these new members act upon their swearing in come January. Owing their victory, largely, to a sizable minority in their district can create complications for a new member. Because these districts have been consistently Republican, these newly minted members will have targets on their backs from the get-go. Nonetheless, their relationship with this sliver of their constituency may prove to be the key to their fate in Congress. If they cast votes or push policy in line with the black electorate (as these voters will surely demand) they may find themselves out of step from the rest of their district. However, should they shun their black constituents, they may find themselves just short of the number of votes they need to secure re-election. Figuring out how to navigate this tricky dynamic will be the first order of business for these new members.

Wednesday, November 12, 2008

Obama's the Big Ten and McCain's the SEC But the Key to the Presidency Might Be the ACC

Rather than spend all of my time on the more traditional number crunching and map making, I thought I’d take a different approach to looking at last week’s election. One thing we know about American politics—and something I’ve written a lot about—is that it’s very regional. Different parts of the country tend to have different types of politics—driven by different demographics, economies, cultures, etc. Another part of American life that is heavily regional is sports. Where we live, where we go to school, and where we were raised tend to affect not only which sports we tend to be interested in (if any) but also the teams to which we’re loyal.

Both candidates this year, we’re told, are rabid sports fans. Much has been written about Obama’s love of basketball and his election day ritual of starting his day with a pick-up game. McCain, from what I’ve read, is a rabid boxing fan. So, can we merge politics and sport—in other words, how might we use the lens of sports to view the returns? As the college football season is approaching its most crucial weeks and college basketball is just gearing up (Go Marquette!!), I thought I’d see there were any parallels to the regionalism of college sports and the election returns.

College athletics is organized around a series of regionally based conferences, the six largest of which are part of the BCS (Bowl Championship Series). These six conferences are the Big East, Atlantic Coast Conference (ACC), Southeastern Conference (SEC), Big Twelve, Big Ten, and Pac Ten. The membership of each conference is as follows:

Big East: Cincinnati, Connecticut, DePaul, Georgetown, Louisville, Marquette, Notre Dame, Pittsburgh, Providence, Rutgers, Seton Hall, South Florida, St. John’s, Syracuse, Villanova, West Virginia

ACC: Boston College, Clemson, Duke, Florida State, Georgia Tech, Maryland, Miami, North Carolina, North Carolina St., Virginia, Virginia Tech, Wake Forest

SEC: Alabama, Arkansas, Auburn, Florida, Georgia, Kentucky, LSU, Mississippi, Mississippi St., South Carolina, Tennessee, Vanderbilt

Big 12: Baylor, Colorado, Iowa St., Kansas, Kansas St., Missouri, Nebraska, Oklahoma, Oklahoma St., Texas, Texas A&M, Texas Tech

Big Ten: Illinois, Indiana, Iowa, Michigan, Michigan St., Minnesota, Northwestern, Ohio St., Penn St., Purdue, Wisconsin

Pac 10: Arizona, Arizona St., California, Oregon, Oregon St., Stanford, UCLA, USC, Washington, Washington St.

These conferences cover the entire geographical breadth of the U.S. Thus, they represent the diversity of the American voting public. What I thought would be fun to do is look at how each conference voted last Tuesday. I took each school and looked at how its state and county (in which the school resides) voted. You see some pretty interesting things. The Big Ten, for example, is the most pro-Obama conference. All 8 states in which its schools reside voted for Obama, as did all 11 counties (there are 11 schools in the Big Ten since the addition of Penn St.). The Big Ten schools occupy the industrial Midwest from Pennsylvania to Iowa, the region of the country that Obama dominated, including his pickups of Indiana and Ohio.


The most pro-McCain conference?? Not surprisingly it’s the SEC. Encompassing the deep south, McCain’s base of support, McCain won 8 of the 9 SEC states (losing only Florida). At the county level, however, Obama actually did much better. He won 7 of the 12 counties in which these schools reside (Alachua—Florida; Athens-Clarke—Georgia; Fayette—Kentucky; Oktibbeha—Mississippi St.; Richland—South Carolina; and Davidson—Vanderbilt). Thus, we may see some evidence of the youth vote (which gave Obama 2/3 of their vote) coming through for the Democrat as well as all those liberal faculty members.

The most interesting conference—and the one that got me thinking about this question in the first place—is the ACC. Since the flip of North Carolina and Virginia from the Republican to the Democratic column, many are wondering if the “solid South” is beginning to disintegrate. Given that the ACC encompasses the border area of the east coast—part northern, part southern—its voting might reflect the bipolar nature of the region and whether it is now being pulled in one direction more than the other. Indeed, 5 of the 7 ACC states went to Obama (Clemson in South Carolina and Georgia Tech in Georgia went McCain). At the county level, Obama won 11 of the 12 ACC counties (losing only Pickens County South Carolina, home to Clemson). In most of these counties, the Obama margin was quite large. Only in Montgomery County Virginia (Virginia Tech) did he get less than 55%.

To round out the remaining conferences, the Big 12 was McCain’s next strongest at the state level. This conference encompasses the central plains, another area of Republican strength. Of the seven total states McCain won 5 (losing Colorado and Iowa). Like with the SEC, however, things at the county level were more evenly matched as each candidate won 6 counties.

The Big East is the largest conference geographically (I’m using its expanded basketball membership rather than its 8 team football membership). Stretching from Rhode Island to Wisconsin (Go Marquette!!) and also having South Florida, it’s the least geographically distinct. Nonetheless, it was strongly in the Obama camp. He won 11 of the 13 Big East states (losing Kentucky and West Virginia). At the county level, though, he made a clean sweep of the 16 counties. Monongalia County West Virginia (Morgantown) gave Obama a slim win with 51% as did Hamilton County Ohio (Cincinnati) with 52% and Hillsborough County Florida (USF) with 53%.

Finally, the PAC 10 was strongly Obama and might have given him a clean sweep had it not been for Senator McCain’s presence on the balance. With the exception of Arizona, Obama won 3 of the conference’s 4 states. At the county level, he won 9 of 10, losing only Maricopa County Arizona (Arizona St.) where McCain got 55%.

So, what can we learn from this?? All in all this may not teach us much new but rather allow us to use a different lens through which to view our politics. The dominance of Obama at the county level—he won 89% of the counties surveyed (57 of 64) illustrates, it seems, not only the role of the youth vote but also something about areas that revolve around university life. Even in the Deep South, Obama did well in those areas that have universities in their midst. Beyond students, one is likely to find a populace in these cities and counties with a higher degree of education and income than in the surrounding parts. As the Democrats’ share of the vote among the high education/high income demographic continues to grow, we might begin to see more change at the state level. The concept of the “ideopolis” is key to “The Emerging Democratic Majority” thesis. What we saw last week in North Carolina and Virginia (home to 6 schools in this survey) might be a harbinger for things to come.

Tuesday, November 11, 2008

Tippecanoe and Obama Too

Perhaps the biggest surprise of last Tuesday was Indiana's move to the Democratic column. Not since LBJ's landslide 1964 victory had the Hoosier State gone blue. In looking at the returns we see that Obama was able to drastically improve upon the performance of past Democratic candidates. His vote share grew in every county versus Kerry's 2004 performance, as the map at left shows (for some coverage from the Indianapolis Star, see here). He was able to win 12 more counties than Kerry (15 total), and his performance in Marion County (Indianapolis) allowed him to generate a huge number of votes to help tilt the state. In 2004, Kerry beat Bush in Marion County by 2% (6,000 votes). This year, Obama beat McCain there by 28% (107,000 votes)!

As during the Democratic primary, Lake County was also crucial to Obama's success. Essentially a part of the Chicago metropolitan area, Lake County's Democratic share increased 6% over 2004 and gave Obama a 71,000 vote margin.

You might also look at the Indiana college population for part of this year's margin. Monroe County (Bloomington) is the home of Indiana University. In 2004, Kerry won the county by 8%. This year, Obama's margin was 32% (20,000 vote margin). Tippecanoe County (West Lafayette) in north east Indiana is home to Purdue. Whereas Bush won Tippecanoe by 20% in '04, Obama switched the county, winning it by 12% (8,000 vote margin). Finally, the University of Notre Dame resides in St. Joseph's County (South Bend). Here we saw another switch--whereas Bush won the county by 2% in '04, Obama enjoyed a 17% win (20,000 vote margin) this year.

For all the details on Indiana politics, see Howeypolitics.com.

Monday, November 10, 2008

The End of the Southern Strategy?

Appropos of my last post, today's New York Times has a long piece on the decline of the south's importance in presidential elections. Given that Obama's margins were worse than Kerry's in the region, despite the widespread economic hardships, and yet he won with such a large margin leads many to ask about the region's relevance. With North Carolina and Virginia breaking with its neighbors in the Old Confederacy, it may no longer be correct to think of the south as a monolithic force in our politics.

Thursday, November 06, 2008

The Appalachian Problem Returns


The above map has been getting a lot of attention over the past day. It shows the counties where McCain actually overperformed Bush '04. We see a very clearly defined geographical region--Appalachia, especially the southern stretch--as the source of McCain's strength. During the Democratic primary, there was much discussion of Obama's "Appalachia Problem." For a refresher, the map below illustrates how deep Clinton's support was there (the more blue, the more pro-Clinton).


In a further examination of this, Ben Smith at Politico brings forward the final map below that charts American's self-identified ancestry. The same pattern jumps out as this part of the country is dominated by people who identify their ancestry as "American." In short, this is a region in which large numbers have family ties that stretch back multiple generations--very low levels of movement in and out. Thus, unlike parts of the neighboring states of Virginia and North Carolina, which have seen a much more dynamic population flow (especially Northern Virginia and Research Triangle of N.C.), this interior is perhaps more isolated from the trends and changes that have affected some of their neighbors. Virginia and North Carolina (and seemingly Colorado out west following a similar track) may have thus crossed the threshhold necessary to vote for a Democrat for the White House.

Big Blue Badger

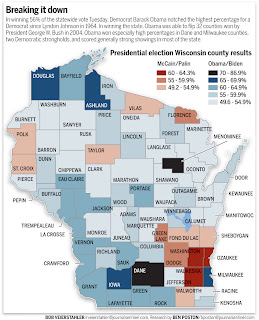
As I hinted yesterday, the results from Wisconsin were staggering for Obama, compared to past Democratic performance. He flipped 32 counties from '04 and won statewide by 13 points. The map at left gives you a sense of where the greatest upticks took place. As I've been saying for a long time, the key for Wisconsin Dems is not just Milwaukee and Madison, its the Mississippi River counties. You can see the big Obama performance there.

Also of interest to me was the voting in the city of Milwaukee. Obviously Obama was going to win big there--and he did with with 78%--but I was curious about the south side. The south side of Milwaukee has always been Democratic territory but it is the home of Milwaukee's white ethnic (mostly Polish and German) blue collar community--Joe the Plumber land, in short. In 1964, George Wallace actually kicked off his campaign at Serb Hall, one of the south side's venerable gathering spots and home to a wicked Friday night fish fry. Given what we saw during the primaries in Chicago (see post here) I wondered whether McCain might actually win parts of the south side. Well, now that we've got some data, it appears that Obama actually carried it. See the map below which shows this year's citywide vote in comparison to 2004. McCain may have actually won some individual precincts here but until that data becomes available, we can't be sure. I'll also be interested in some of the inner suburbs that come off the south side--Greenfield, West Allis--to how Obama performed.

Lots more Wisconsin analysis to come.

Maps courtesy of the Milwaukee Journal Sentinel.

Wednesday, November 05, 2008

The Day After

Today, mostly quick hits:

Florida. As I wrote about a few weeks back, the I-4 Corridor was indeed the key. Obama vastly outperformed Kerry, winning Pinellas (54%), Hillsborough (50.1%), and Orange (59%) Counties--the three biggest in the region.

Wisconsin. Huge Obama win--13 points. As expected big margins in Milwaukee and Dane Counties, but most impressive was the broad scope. McCain only won 13 of the state's 72 counties. In contrast, despite losing the state narrowly in '05, Bush won 45 counties. Outagamie and Brown Counties (see earlier post for more prescience) go Obama--54% each. Dems. also captured the State Assembly in Wisconsin.

The Republicans have 0 members of the House of Representatives from New England. See this to see how the region, once so solidly Republican, has been completely transformed. As I get the final House results, I'll update more fully, but increasingly the Republican House caucus is southern and rural.

Paging Dr. Schaller! Paging Dr. Schaller! Exit polls in Alabama show that 8 in 10 whites voted for McCain. In Mississippi, 88% of whites went for McCain.

Tuesday, November 04, 2008

Election Night Live Blogging!!!

John and I are here in the ElectionDissection.com election results bunker. As the results come in, we'll try and focus on things that jump out at us as interesting or important, rather than just repeat everything that's on TV or the major news sites.

Little data so far. MSNBC is reporting Obama outperforming Kerry significantly in a number of Indiana counties, especially in the northern part of the state. CBMurray

8:22 pm. Some numbers out of Florida. Obama running up big numbers in Orange County (Orlando). Narrowly won by Kerry, Obama winning big here. Part of the crucial I-4 Corridor, the key to winning the Sunshine State. CBMurray

8:29 pm. Also from Florida, Hillsborough County (Tampa). Again, Obama running ahead of Kerry. Bush won the county in 04 with about 54%. CBMurray
 
8:32 pm. A crucial Virginia county, Prince William. Obama ahead so far. CBMurray

10:49 pm. Was out for a while doing some local radio. A lot of data coming in, really overwhelming, but this thing is essentially over. Only question now is the margin.


10:56 pm.  Moderate suburban seats that pundits wrote off for the Dems are remaining competitive, even as those seats' core counties trend heavy for Obama, Dem at pres level.  Rep. Mark Kirk is holding on in Chicago's Collar Counties, as Obama clobbers McCain there. 

And - popular Fairfax Co. Exec. Gerry Connolly is stumbling across the finish line in No. Virginia.  Most pundits had written off the former GOP garrison, with its thinly-resumeed nominee who sought to hold onto moderate GOP Rep. Tom Davis' seat.  But Keith Fimian is outperforming Obama in Fairfax County.  

Obama is only pulling down 58% in a Fairfax, where many observers thought he might reach 65%.  Perhaps residual military-affinity among NoVa voters kept them loyal to the GOP one last time? JVLaB

11:30 pm.  Wautaga Watershed proves prescient! Riding larger statewide tredns, Obama takes in Wautaga Co., No. Carolina, helping pad Obama's narrow margin in the state represented by Jesse Helms as recently as 2002. 

Wednesday, October 29, 2008

Harold Washington, Barack Obama, and the Game Plan for Victory---Should We Have Seen This Coming??


A few months ago, in the midst of the primary season, I wrote a post wondering about how black turnout might affect the general election. Having done a lot of reading on Chicago politics over the past few years, I was becoming convinced that the Obama campaign was using a playbook that had proven successful in its own backyard, 25 years prior.

In 1983, Chicago elected its first African American mayor, Harold Washington. The election of Washington was an arduous two step process. First, the reformist Washington campaign had to win a bruising three way primary against incumbent Mayor Jane Byrne and Richard Daley, Jr., son of the deceased former mayor (and current mayor). With Byrne being the Democratic machine candidate and Daley the namesake of the city’s most dominant political family, Washington’s candidacy succeeded largely due to massive increases in black registration, mobilization, and turnout. For example, between the 1979 and 1983 mayoral races, registration in Chicago’s majority black wards increased 30% (as opposed to only a 4% increase in the rest of the city). The final tally gave Washington 37%, Byrne 33%, and Daley 30%. While the racial dimension of the campaign was evident in the primary, the general election brought a whole new level of rancor. Whereas the city was long dominated by the Democratic machine, giving Republicans few chances to win citywide office, Washington’s place at the top of the ticket led large swaths of Democratic voters to cross party lines and support Bernard Epton. Many of the city’s Democratic machine leaders agitated against Washington’s bid, using tactics and language that was anything but subtle in their racial overtones--Epton's campaign slogan was "Before It's Too Late." Again, Washington had to rely on black turnout and mobilization (coupled with support from high income, high education level whites). In the general, Washington narrowly won with 51.4% of the vote. Again, black turnout was huge—75%!!

Writing in the immediate aftermath of Washington’s victory, University of Maryland political scientist Ronald Walters wrote:

…the Washington campaign illustrated that a black candidacy could bring formerly politically inactive people into the electoral process and could make politics take on a relevance and urgency for those who had previously seen little connection between elections and their own lives. It also showed that participation by people who usually opt out of the system could change election outcomes (PS, Summer 1983; p. 492).

Thus, coming into this year’s election season, the Obama campaign surely realized that black turnout would be an important, although certainly not definitive, determinant of their success. While the Obama campaign’s financial juggernaut has been unprecedented and his appeal to young and upscale white voters has been crucial, one can’t ignore the degree to which the black vote has been the backbone of the campaign. Given the delegate allocation formula used by the Democrats, Obama was able to take advantage of his near universal support among black voters to ensure that Hillary Clinton was unable to gain ground quickly, despite her victories in states like Ohio and Pennsylvania. With the early date of the South Carolina primary (with its large black electorate) Obama’s campaign was given a boost heading toward the Super Tuesday blockbuster of contests. These early victories also sent a signal to black voters, as described by Walters above, that their participation could indeed determine the outcome of the race.

One consequence of Obama’s success in the primaries, which I’ve also written about, is that it placed many established African American politicians in a difficult position. Long allies of the Clintons, these members of Congress, mayors, and Democratic insiders failed to see the oncoming Obama phenomenon. In fact, several faced (and may in the future face) primary challenges as a result of their initial snubbing of Obama. For many, Hillary Clinton was the safe, and rational, pick. Here again, some parallels to Harold Washington become apparent. In his campaign against the Chicago Democratic machine, Washington broke from a number of black Chicago leaders who, by providing the machine with scores of black votes, received patronage, neighborhood power, and electoral security over the years. Writing about this tension between insurgent and establishment politicians, the Brookings Institutions’ Paul Peterson wrote:

Black political leaders nationally have many of the same difficulties that the Washington candidacy posed for black aldermen and committeemen in Chicago. If they support the problematic candidacy of an insurgent, all the past ties and connections with leading white political figures, from which many identifiable benefits flowed, would be endangered. A black candidacy that achieved only modest success could leave them politically isolated. But if they decide not to support a black insurgent who succeeds at mobilizing the black community, the close connections with white leaders would only appear to black constituents to be still another example of having “sold out.” Even as many black aldermen lost their seats to Washington’s supporters, so black mayors and congressmen who fail to support one of their own brothers for president become vulnerable to local challengers. (PS, Fall 1983; p. 716).

Sound familiar???

To add another layer, I came across an
old article from Chicago Magazine, written in January 1993. The author discusses further increases in black mobilization in Chicago, this time focused on the election of the Clinton/Gore ticket and Illinois Senator Carol Moseley-Braun, the first African-American woman ever elected to that position. The focus of the piece is Project Vote!, an organization formed to increase minority and low income voter registration. Whereas voter registration had normally been the purview of the Democratic Party machine in Chicago, Project Vote!’s efforts were conducted outside the party apparatus and were community based. For the 1992 campaign, the organization was successful in adding 150,000 black voters to the rolls. Bill Clinton’s win in Illinois and especially Moseley-Braun’s upset primary unseating of incumbent Senator Alan Dixon were aided by these new voters. Who was the Director of Project Vote!, you might wonder??? A 31 year old lawyer named Barack Obama. The article concludes with a young Obama being asked about his own political ambitions:

Obama shrugs off the possibility of running for office. “Who knows?” he says. “But probably not immediately.” He smiles. “Was that a sufficiently politic ‘maybe’? My sincere answer is, “I’ll run if I feel I can accomplish more that way than agitating from the outside. I don’t know if that’s true right now. Let’s wait and see what happens in 1993. If politicians in place now and the city and state levels respond to African-American voters’ needs, we’ll gladly work with and support them. If they don’t, we’ll work to replace them. That’s the message I want Project Vote! to have sent.”

So how might we gauge whether any of this emphasis on registration and mobilization, especially among African-Americans, is paying off??? Over the past few days we’ve started to receive some data on the early voting that is taking place across a number of states, including key battlegrounds like Florida and North Carolina (see this great site from GMU’s Michael McDonald). What seems to be taking place is tremendous, and unprecedented, black turnout. As Nate Silver at fivethirtyeight.com has pointed out, the states with the biggest increases in early voting, compared to 2004, are those with large black populations. We’re also seeing early voting spikes in counties in Ohio with large numbers of African-American voters. Thus, while we’re expecting to see higher than normal turnout among all voters nationwide, the more interesting question is what gap will exist between white and black voters. In 2004 white turnout was roughly 65% while black turnout was about 60%. What happens if black turnout not only grows (perhaps to parity with white turnout) but maybe even surpasses that of whites in some places? Should that happen, then the math starts to get really interesting, electoral votes start going red to blue, and what might normally be a close election starts to move toward landslide territory.

Thus, as we approach election day it’s hard not to think that the groundwork for the Obama campaign was put in place well before he announced his candidacy in early 2007 and before his famous address to the 2004 Democratic National Convention. Rather, much of what we’re seeing materialize has its roots in longstanding efforts begun back in Chicago. Many commentators have looked to previous elections for parallels to what we’re seeing this year—Is 2008 like 1992? 1980? 1932?

Should Obama win next Tuesday, my vote goes not for a presidential race in our past, but rather a mayoral one--1983. The fact that some of this year’s participants were either involved in or influenced by that campaign should, perhaps, have gotten a lot more attention by a lot more people.

Tuesday, October 28, 2008

Some Thoughts On the South

If you’ve been reading my posts over the course of the campaign, you know that the issue of race is something I’ve written a lot about. Well, in a week we’re going to get a lot of data that will clarify many of the questions I’ve been raising and obsessing over.

One of the big questions that has been posed is how Obama will fare in the south. Will the legacy of George Wallace be purged forever? Will black turnout be so high in some states, as to make their electoral votes attainable for the Democrats? Do white southern voters think and vote differently than white non-southern voters? Does the Bradley effect exist, and if so, does it exist everywhere or is it more regionalized?

However these questions get answered, one thing that can’t be ignored is the fact that by having a reason to ask these questions—the reality of the Obama candidacy—we have demonstrated progress. We’ll no longer have to ask ourselves “If an African American got nominated for President, would he win?” Now we’ll know. While race won’t be the only reason Obama wins or loses, it will be a variable that we can finally start to put some flesh on. As a political scientist, I can’t wait to start digging into the numbers.

In thinking about the historic nature of the Obama campaign, I came across on old Time magazine from 1971 focusing on the “New South.” Featuring the just elected Governor of Georgia Jimmy Carter, the issue looked at how the region was trying to move beyond its old, race dominated politics:

Throughout the South, there are signs that the region is abandoning the fateful uniqueness that has retarded its development and estranged its people. William Faulkner’s South—heavy with ghostly Spanish moss, penumbral myths and morbid attachment to the past—is giving way to a South that has discovered it does not need fable to shore up its pride or the past to cloud its future. Moreover, a generation after the process was largely completed in the rest of the U.S., the South is caught up in an economic expansion that is reshaping the social order. The South has become at last a region of investment, both human and economic.

Making history—not living in its vainglories and myths—is the challenge and promise of the South today. The Southern frontier closed in that awful moment when the first man came to the South in bondage, locking the Southern experience into its tragic course. Three and one-half centuries later, the thrall can be broken, the frontier reopened. The South can grown rich while there is still time to safeguard the land from despoliation. It can acquire once more the political power of the sons who helped articulate the nation’s independence. Above all, it has a chance to shed its old hatreds and show the U.S. the way to a truly integrated society.


A little too optimistic or premature?? Perhaps. But should the election returns coming out of places like Virginia, North Carolina, Georgia, and other states next Tuesday show high levels of support for Obama, and produce electoral votes, we should remember that these votes were not generated in an instant or in a vacuum. Southern voters, like all voters, have grown up, lived, and been politically socialized in a historical and social context. This context evolves and develops over time. Thus, it’s appropriate to appreciate the history of this evolution.

Of course it may turn out that the southern vote will continue to be the outlier in terms of willingness to support a black candidate. Here we return to the thesis of Thomas Schaller in “Whistling Past Dixie.” In short, Schaller believes that Democrats are unable to compete in these Deep South states because of how race clouds the vote choices of white voters. An ingrained racial backlash—especially heightened with a black candidate at the top of the Democratic ticket—works to the advantage of the Republicans. While I don’t normally focus much on polls in my posts, recently released polling suggests that this explanation for southern attitudes might not be pure fiction.

Some good test cases for the role of race in these states might be found down-ballot on Tuesday. In both Georgia and Mississippi, two U.S. Senate races have become highly competitive. In Mississippi, incumbent Republican Senator Roger Wicker (appointed upon the retirement of Trent Lott) finds himself in a tough race against former governor Ronnie Musgrove. In Georgia, Saxby Chambliss is seeking a second term against Democratic challenger Jim Martin in a race that few thought would be close. What I’m interested in comparing is the difference between the votes for Musgrove/Martin and Obama. If we assume that every African American in Georgia and Mississippi who votes for Obama will also vote for Musgrove or Martin (not a perfect but, it seems, pretty reasonable assumption), then the difference between the Senate votes and the Obama vote should show us, roughly (we also need to account for the Hispanic vote) whether white voters had different evaluations of the presidential and senatorial candidates. If the Senate candidates outperform Obama, then there would seem to be reason to suspect that race was a factor.

Whatever happens on Tuesday, we’re going to be in a better position to answer some of the most vexing questions that have infused our politics going back generations. Stay tuned for the analysis.