
Some interesting things coming out of Michigan. On the Democratic side, the fact that only Clinton was on the ballot makes interpreting the results--Clinton vs. "Non committed" somewhat troublesome. Namely, we don't know how this affected turnout. With no delegates at stake and the major candidates not campaigning there, its hard to use the results as a gauge for what a true Michigan Democratic primary would have looked like. Nonetheless, Thomas Edsall's look at the exit polls reveals some interesting things vis a vis Clinton vs. Obama. As in the earlier contests, Clinton does better among the less affluent and the older, Obama better among the younger and more affluent. When it comes to race, Clinton fared very poorly. A bad omen for South Carolina?
Interactive maps for both parties. Note that Clinton lost in Washtenaw county, home of the University of Michigan.
Wednesday, January 16, 2008
Monday, January 14, 2008
Some Interesting Commentary
Yesterday's column by George Will raised some interesting points and brought to the forefront some data I hadn't really realized.
I found these two paragraphs particularly of interest...
Granted, in the past 150 years, Franklin Roosevelt, Lyndon Johnson and Jimmy Carter (barely) are the only Democrats to achieve 50 percent of the popular vote. And this year Democrats might still give Republicans the gift of Hillary Clinton, who probably has a popular vote ceiling of 52 percent. A subliminal -- too much so -- subtext of Obama's message is that Clinton cannot receive the big mandate required for big changes: Enactment of Social Security in 1935 followed Franklin Roosevelt's 57.4 percent victory in 1932, and in 1965 Medicare came after Lyndon Johnson's 61 percent victory over Barry Goldwater.
But even if Democrats nominate Clinton, Republicans must remember that Bush's 2.4-point margin of victory in 2004 was unimpressive: In the 12 previous reelections of presidents, the average margin of victory was 12.9 points. Bush's 50.7 percent of the vote in 2004 was the third-smallest for a reelected president (Woodrow Wilson and Bill Clinton won 49.2 percent in 1916 and 1996, respectively). Kerry's 48.3 percent was the largest ever against a president being reelected. (In the 12 previous reelections, no losing candidate received more than 46.1 percent; nine of the losers received less than 45 percent.)
Wednesday, January 09, 2008
New Hampshire Results
County and town level results for the Democrats and Republicans. Interactive map. More data and analysis to come.
Tuesday, January 08, 2008
Huckabee and Catholics


By way of Polysigh, some number crunching on Huckabee's Iowa win. The more Catholic counties were less likely to support him. Not good news when you think about the national ramifications. If the GOP nominates Huckabee and becomes even more southern-based, this could be a trend working against them in November.
The blue counties are Huckabee counties, the Red are Romney. In the bottom map, the darker the red, the more Catholic the county.
Friday, January 04, 2008
Iowa Caucus Results
County level results for the Iowa Caucuses
A nice interactive map of the GOP results.
Also, interesting results from the entrance and exit polls. Pretty clear across the board win for Obama. The media has already highlighted the women's vote tilting to Obama.
A nice interactive map of the GOP results.
Also, interesting results from the entrance and exit polls. Pretty clear across the board win for Obama. The media has already highlighted the women's vote tilting to Obama.
Thursday, March 15, 2007
Back to Philly---'76 and '80


As we continue our look at Philadelphia, we focus now on the 1976 and 1980 races. Again, we're interested in what happened to those voters that gave the highest support to Wallace in '68. Our running hypothesis is that the Wallace vote was a step on the way to becoming more Republican in orientation. Our look at 1972 saw evidence to that effect. How lasting was it?
A few things first. In '76, Carter carried the city of Philadelphia easily, winning 66% of the vote and carrying 63 of 66 wards. Therefore, we're not so much interested in whether Ford won "Wallace Wards," but how Republican they were, relatively speaking. In 1980, Carter also won Philly garnering 59% to Reagan's 34% and John Anderson's 7%. Ward by ward, Reagan fared better than Ford, winning 24 of the 66 wards.
Finally, we should note that over the time period we've been looking at, the African-American population of the city has been growing, both in raw number and percentage of the city population. The African-American population grew 24% between 1960 and 1970 and then lost 2% from 1970 to 1980. As a percentage of the overall population, African-Americans were 26% of the city population in 1960, 34% in 1970, and 38% in 1980.
Looking back at our "Wallace Wards," remember that the 10 wards that Wallace did best in were: 40, 7, 45, 31, 33, 25, 41, 66, 65, and 39. Below, I've listed how Republican each of these wards were in '72, '76, and '80 (1 being most Republican, 66 being least Republican).
Ward 40: 25, 28, 26
Ward 7: 18, 31, 25
Ward 45: 22, 23, 19
Ward 31: 13, 17, 24
Ward 33: 17, 20, 18
Ward 25: 15, 24, 21
Ward 41: 11, 11, 11
Ward 66: 2, 4, 1
Ward 65: 12, 18, 13
Ward 39: 5, 15, 5
What we see is that the gains that Republicans made under Nixon in 1972 seem to have held by the time we get to 1980. While these wards are not the most Republican in the city, they have nonetheless given considerable support to Ford and especially Reagan. Any gains that Carter made disappeared four years later.
An obvious point to remember, of course, is that population shifts would have certainly caused the demographic portraits of each of these wards to change. Many of the white ethnic voters that we're interested in probably left the city for the suburbs between '68 and '80. However, it doesn't seem as if these voters were replaced by African-American voters. Otherwise we would have expected these wards to become considerably more Democratic. Thus, absent more sophisticated data, it seems reasonable to conclude that our running hypothesis has some validity to it.
Wednesday, March 14, 2007
Wallace and 1968

"The true cause for concern, however, is not what Wallace might have done, but what he did. When Wallace said he made both the major parties talk his own language of law and order, he was wrong. They would have done it without him. He was not the cause but an effect; he was one way of measuring the growth of resentment...Wallace offered neither palliative nor real cure; just a chance to scream into the darkness. It was a kind of perverse exercise in honesty--a proclamation that the darkness is there.
Garry Wills, "Nixon Agonistes"
More from '68---Charm City

Baltimore is a city that we would have expected Wallace to do well in, given everything we've seen in other cities so far. It is industrial with a large number of white ethnics, yet also very southern in orientation. A true border city. As we see, Wallace's performance in several wards doubles his national vote and triples his "non-southern" vote. We should also remember that in 1968, Baltimore's own Spiro Agnew was on the Republican ticket. Wallace's performance is, thus, all the more impressive.
The Baltimore area also saw a considerable amount of anti-war protesting under the direction of Daniel and Philip Berrigan. One can imagine how well the reaction to this among white ethnics played to Wallace's strengths.
Friday, March 09, 2007
More From Philadelphia


Of interest here is what happened to Wallace's 1968 voters. Did they return to the Democratic fold or did they become Republicans. By looking at the subsequent election, 1972, we see clear movement to the Republican camp.
Philadelphia has 66 wards. In '68, Wallace received 11.95% of the vote in the city. To look at the movement rightward among these voters, I've decided to concentrate on the 10 wards where Wallace did best (wards 40, 7, 45, 31, 33, 25, 41, 66, 65, and 39). If Nixon did well in these wards in '72, there's reason to believe that many of these Wallace voters were becoming more Republican.
In the '72 election, Nixon received 48.3% of the vote in the city of Philadelphia. Thus, despite the nationwide Nixon landslide, McGovern managed to win the city. Of the 66 wards, Nixon won 28.
In looking at the "Wallace Wards" from '68, we see that Nixon won all of them. In fact, 2 of the most Republican wards in 1972 were among the top 10 Wallace wards in '68. Here is a ranking of each top Wallace ward in terms of how Republican it was in 1972 (1 being most Republican, 66 being least Republican) as well as Nixon's vote %.
.
.
Ward 40---25th most Rep. (55.9%)
Ward 7----18th most Rep. (58.4%)
Ward 45---22nd most Rep. (57.0%)
Ward 31---13th most Rep. (59.3%)
Ward 33---17th most Rep. (58.4%)
Ward 25---15th most Rep. (59.0%)
Ward 41---11th most Rep. (60.1%)
Ward 66---2nd most Rep. (65.4%)
Ward 65---12th most Rep. (59.8%)
Ward 39---5th most Rep. (62.9%)
.
.
One might wonder whether this Nixon support is simply a "pro-incumbent" effect. Next up we'll look at what happened in these wards in 1976 and 1980.
Tuesday, March 06, 2007
Another Way to Look at the Wallace Vote
For the past several posts, I've been looking at the performance of Wallace in several northern cities. In all of these, I've been comparing the Wallace vote against his national performance--13.5%. As we know, Wallace's core strength was in the south where he won five states: Arkansas, Louisiana, Mississippi, Alabama, and Georgia.
To look at this another way, I ran the numbers to allow me to look at Wallace's "non-southern" performance. When we separate out Wallace's southern support, his performance in northern cities becomes all the more impressive, and hence worth dwelling on.
In doing this, I used Kevin Phillip's "The Emerging Republican Majority" as the model. His work, which emphasizes the regional dimension of party competition, defines the south as including: Alabama, Arkansas, Florida, Georgia, Louisiana, Mississippi, North Carolina, South Carolina, Texas, and Virginia. So, when we take these states out of the equation, Wallace received 8.8% nationwide.
Looking at the maps posted below in this light, we can see just how important Wallace's candidacy was. In many of these northern urban wards, he more than doubled his "non-southern" performance. Wallace's candidacy was important not just for what it said about American politics in 1968, but for years afterwards.
Philadelphia 1968

Here is the Philadelphia map portraying the Wallace vote in 1968. As with many of the northern cities I've shown so far, Wallace meets or exceeds his national performance in several wards. Again, urban white ethnics seemed, despite Wallace's "southernness," drawn to his candidacy.
Friday, March 02, 2007
Wallace in the Northern Cities, Cont.


Here we have the '68 Wallace vote in two northern industrial cities---Pittsburgh and Cleveland. Again, Wallace's nationwide vote total was about 13.5%. He exceeds that support in many of these urban wards.
Cheese and Cracker

Here is the 1968 Wallace vote in the city of Milwaukee. This is a city that I would have initially thought he would have done very well in. Just prior to the '68 race, Milwaukee had been going through some extremely turbulent protests, mostly centered around the issue of open housing, headed by Fr. James Groppi. These protests galvanized much of the urban white ethnic population.
Milwaukee has historically been an extremely segregated city. The urban white ethnic population (mostly Polish and German) is most concentrated in wards 8, 11, 12, 14, 17, and 19. This is where one would expect to see Wallace do the best. In fact, we see that his vote performance, while slightly below his national average, is not as strong as we saw in some Chicago wards. As I'll be showing in future posts, other northern industrial cities, most notably Cleveland, saw Wallace do extremely well.
What may explain Wallace's lower than expected performance here is a greater Nixon share of the vote than one would expect. In other words, rather than stopping off with Wallace on the movement to the Republicans, Milwaukee's urban white ethnics may have skipped the Wallace step altogether. We shall see in future posts.
Thursday, March 01, 2007
More From Chicago


Here is a comparison between the Republican vote in the 1964 and 1972 presidential election in Chicago. In each ward I've written the Republican % of the vote. As I argued yesterday, the '68 Wallace vote can be viewed as a stopping point for urban white ethnics from being solidly Democratic to much more Republican. We see some more evidence of that trend here. The wards that I'm most interested in are the south side and north west side. These wards tended to have the highest concentration of urban white ethnics.
Obviously, we must remember that there will have been population shifts and demographic changes between these elections. Nonetheless, using this rough representation, we see some pretty clear movement. As I suggested in my previous post, my suspicion is that there is a strong "backlash" dimension to this trend as urban white ethnics responded to the turmoil of the civil rights movement as well as the "great migration" that witnessed an explosion in the African American population in northern industrial cities like Chicago.
More to come.
Wednesday, February 28, 2007
New Project
Much too long without a post. Now that the post-election analysis has quieted down a bit, I want to move into something that I've long been interested in, and much more historical in nature. Specifically, I want to look at the voting behavior of urban white ethnics, especially within the context of the civil rights movement. Having spent a lot of time in Milwaukee, I've always been fascinated (and disturbed) by the deep racial divide and segregation that accompanies not only day to day life, but politics as well. It should be remembered that George Wallace began his 1964 campaign in Milwaukee, not Montgomery, AL.
The political dimension of the civil rights movement has almost always focused on the deep south. Here, I want to focus on the mostly forgotten northern dimension. Following the victories of the 1964 Civil Rights Act and 1965 Voting Rights Act, many expected further advances to follow. As we know, that did not happen quickly, or without massive resistance. Issues such as housing and busing set off massive demonstrations among urban whites in cities like Milwaukee, Chicago, and Boston. I recently read a fascinating book called "Chicago Divided" that looked at Chicago politics from Mayor Daley through the landmark election of Harold Washington in 1983. What this story re-enforced was the power that white ethnic voters wielded in urban politics in throughout the 50's, 60's, 70's, and 80's.
To begin, I want to look at the 1968 Wallace vote in the city of Chicago. Below is a ward map in which I've written the Wallace percentage for each ward.

In 1968, Wallace got 13.5% nationwide. Here we see how in many Chicago wards he outperformed his national average. The cluster of wards of the south side represent the city's concentration of white working class ethnics (Polish, Irish, etc.) These are the voters I'm going to focus on in coming posts. I want to look at different cities and ask not only what explains these voting patterns, but what happened to these voters over time. One thing I expect we'll see--and what many have argued about Wallace--is that these voters used Wallace as a stopping off point on the way to becoming the "Reagan Democrats" of the 1980's.
Wednesday, November 29, 2006
Electoral Arabesque (sic)
Much has been made of the story how then-Gov. George W. Bush captured the bulk of votes cast by Arab Americans in 2000, who were reported to have turned out in record numbers, and how the Bush admin.'s post-9/11 policies drove those same voters to away to the welcoming arms of the Democrats four years later in even more dramatic numbers. Anecdotal evidence abounded, but many observers remained skeptical, noting that though fast-growing, the slice of the American electorate comprised of Arab Americans remained a mere sliver, posing a challenge for any researcher to draw a representative sample.
And, like Asian American voters in much of the U.S., there are few places where Arab Americans have congregated and registered to vote in numbers large enough to be reflected in county, or even precinct, level returns.
In investigating Detroit area returns, I stumbled upon what may be rare confirmation of this story reflected in election returns. In the 1930's, Henry Ford published the Dearborn Independent in the white, working class Detroit suburb, home to many of his employees, as a platform for his anti-Semitic proselytizing. Today, Dearborn, Michigan is recognized as a mecca (no pun intended) for Arab American culture, home to generations-old Christian Arab Americans and more recent Muslim immigrants.
Assuming that in the four year interregnum that the Dearborn City Clerk did not unilaterally renumber the city's precincts, note the stunning plummet in the Bush vote in selected Dearborn precincts here. Other precincts posted less dramatic change, but the overall effect was enough to turn a turn a 52%-44% (with 3.6% for Nader, Dearborn-wide) Bush win in 2000 into a 40%-59% loss four years later.
These precincts posted much higher percentages for Nader than the less volatile precincts, suggesting that these precincts may indeed be heavily Arab American. Nader, remember, is of Lebanese descent and was reported to have gained significant support among his fellow Arab Americans.
Monday, November 27, 2006
Suburban Sweep
USA Today has a story today on the big gains Dems made in the suburbs this year. One need go no further than Pennsylvania, Connecticut, and even Arizona to see the outcome. In inner-ring suburbs, Dems got 60% of the vote, up from 53% in 2002. They won 55%/45% in the next ring of suburbs and cut Republican leads in the growing "exurbs." Here's the study from Virginia Tech's Metropolitan Institute that crunches the numbers. Analysis to come soon.
Yankee Republicans RIP?
From today's New York Times, the loss of New England Republicans is quite staggering. Only one Republican House member from New England--Chris Shays. While the magnitude of this on the congressional level has been discussed for the past few weeks, what happened at the state and local level is equally compelling.
This Confounds Me...
In skulking - only virtually, sadly - around the Tennessee House, a chamber of which, had I been whisked away only weeks before, at an "eccentric millionaire's" behest last winter, I would have enjoyed an insider's tour by one of that institution's resident (and perhaps preeminent) historians, I came across this curiosity: an Afro-Am Democratic state Rep., unopposed in this last election, representing Tennessee's 2nd State House district.
This is curious on two folds: First of all, the Hon. Nathan Vaughan (a very distant relation of the Border Vaughts?) represents Kingsport, although merely the largest settlement, though still yet not the county seat, of Sullivan County, Tenn., the hick 'burgh nevertheless enjoys notoriety as a leg of the tripod known as the "Tri-Cities" of the Volunteer State's Grand Division of East Tennessee. Along with Johnson City, Kingsport shares this distinction with Bristol, where country music as we know it - or never knew it (think Garth Brooks) - was born, commercially, when the haunting sounds of the Carter family, hailing from the Hills & Hollers of SW Virginia, and Jimmie Rodgers, the Blue Yodler transplanted from the Alabama-Mississippi border, were captured, manufactured and disseminated as far and wider than even WSM's signal could travel. Kingsport, though, can boast of its favorite daughter, Miss Bettie Page.
Kingsport's modest industrial heritage rendered it less rock-ribbed in the Republicanism of the surrounding counties of East Tennessee, but it remains a commercial crossroads for area, a Unionist redoubt during the Civil War. Indeed, while presidential races were hotly contested - reflecting the close division here during the "War Between the States" - Sullivan Co. refused to offer up Republican majorities until 1952, save for the anti-Papist fervor of '28. And, though Wallace posted a "respectable" second place in '68, that only underscores how Wallace's populist appeal was broad enough not only to capture votes in the racially charged reaches of the North, but also to make inroads into Appalachia's Mountain Republican counties, once loyal to the Union and, due to the scarcity of Afro-Ams living amongst them, rarely agitated by base racial appeals that resonated through much of the South. That ancestral Unionism bequeathed a history of Republican partisanship not only uncommon to the South, but rarely replicated, then, outside of rural New England.
Indeed, Sullivan County's population is mere 1.89% "Black or African-American," and Kingsport, proper, registers a less modest 4.22% Now, East Tennessee has always had a rebellious streak, not only challenging the Confederacy, but the early United States, too. Sullivan County was included in the ill-fated breakaway "Lost State of Franklin," that sought recognition by the U.S. government in the late 18th Century.
So, I understand how gun owning, peanut farmer Yellow Dog Democrats in Georgia, living among a considerable black population, could be convinced to retain their partisanship when a savvy, Good Ole "Boy" Blue Dog like Sanford Bishop can work the county BBQs and speak their language. But, tell me: how does a honky whose great-great grandpappy came down off the mountain to don a blue uniform and shoot toward Memphis, and his great-grandpappy who never even saw a black man overcome his Republican partisanship to return a black man to the state House with a (D) next to his name?
For more, note this: Kerry didn't even carry a precinct in Kingsport, let alone Sullivan Co. and favorite son, Albert Gore, Jr. only captured two in 2000:
2000 Presidential Election Data - Tennessee
Sullivan County by Precinct
| Precinct | Total Vote | B | G | Margin | %Margin | Bush | Gore | Other | Bush | Gore | Other |
| 01 S Holston Ruritan | 442 | 1 | 2 | 31 | 7.01% | 52.71% | 45.70% | 1.58% | 233 | 202 | 7 |
| 02Hv Holston View | 1,369 | 1 | 2 | 505 | 36.89% | 67.64% | 30.75% | 1.61% | 926 | 421 | 22 |
| 02Vp Valley Pike | 392 | 1 | 2 | 52 | 13.27% | 56.12% | 42.86% | 1.02% | 220 | 168 | 4 |
| 03 Hickory Tree Fire | 464 | 1 | 2 | 142 | 30.60% | 64.44% | 33.84% | 1.72% | 299 | 157 | 8 |
| 04A Avoca School | 844 | 1 | 2 | 153 | 18.13% | 57.94% | 39.81% | 2.25% | 489 | 336 | 19 |
| 04Os Avoca Firehl | 1,018 | 1 | 2 | 258 | 25.34% | 61.89% | 36.54% | 1.57% | 630 | 372 | 16 |
| 05N Sullivan Cnty N | 925 | 1 | 2 | 145 | 15.68% | 57.30% | 41.62% | 1.08% | 530 | 385 | 10 |
| 05S Public Library | 1,232 | 1 | 2 | 308 | 25.00% | 61.61% | 36.61% | 1.79% | 759 | 451 | 22 |
| 06 Central Heights | 845 | 1 | 2 | 160 | 18.93% | 57.99% | 39.05% | 2.96% | 490 | 330 | 25 |
| 07 Indian Springs | 1,845 | 1 | 2 | 735 | 39.84% | 69.27% | 29.43% | 1.30% | 1,278 | 543 | 24 |
| 07C Firehall #3 | 357 | 1 | 2 | 163 | 45.66% | 71.99% | 26.33% | 1.68% | 257 | 94 | 6 |
| 08 Buffalo Ruritan | 506 | 1 | 2 | 108 | 21.34% | 59.29% | 37.94% | 2.77% | 300 | 192 | 14 |
| 09 Piney Flats Fire | 974 | 1 | 2 | 195 | 20.02% | 59.14% | 39.12% | 1.75% | 576 | 381 | 17 |
| 10Bd Ketron Ms | 1,283 | 1 | 2 | 269 | 20.97% | 59.78% | 38.82% | 1.40% | 767 | 498 | 18 |
| 10Ob Orebank Mb | 640 | 1 | 2 | 114 | 17.81% | 57.19% | 39.38% | 3.44% | 366 | 252 | 22 |
| 11Aj A Johnson Sch | 554 | 1 | 2 | 46 | 8.30% | 53.25% | 44.95% | 1.81% | 295 | 249 | 10 |
| 11C Kingsport Annex | 547 | 1 | 2 | 39 | 7.13% | 52.29% | 45.16% | 2.56% | 286 | 247 | 14 |
| 11Cg Cedar Grove | 949 | 1 | 2 | 205 | 21.60% | 59.96% | 38.36% | 1.69% | 569 | 364 | 16 |
| 11D Dickson Center | 765 | 1 | 2 | 148 | 19.35% | 58.56% | 39.22% | 2.22% | 448 | 300 | 17 |
| 11E Renaissance Ctr | 741 | 1 | 2 | 263 | 35.49% | 67.21% | 31.71% | 1.08% | 498 | 235 | 8 |
| 11G Gravely School | 499 | 1 | 2 | 93 | 18.64% | 58.32% | 39.68% | 2.00% | 291 | 198 | 10 |
| 11J Grace Evangel | 1,024 | 1 | 2 | 237 | 23.14% | 60.55% | 37.40% | 2.05% | 620 | 383 | 21 |
| 11R Kingsport Ch. | 1,194 | 1 | 2 | 230 | 19.26% | 58.46% | 39.20% | 2.35% | 698 | 468 | 28 |
| 11S Civic Auditorium | 973 | 2 | 1 | 158 | 16.24% | 40.90% | 57.14% | 1.95% | 398 | 556 | 19 |
| 11W Kingsport Libry | 651 | 2 | 1 | 22 | 3.38% | 47.00% | 50.38% | 2.61% | 306 | 328 | 17 |
| 12Br N. Kpt Firehal | 526 | 1 | 2 | 127 | 24.14% | 61.41% | 37.26% | 1.33% | 323 | 196 | 7 |
| 12Cb Ridgefields | 1,096 | 1 | 2 | 346 | 31.57% | 64.87% | 33.30% | 1.82% | 711 | 365 | 20 |
| 12Lg Lynn View Ms | 589 | 1 | 2 | 52 | 8.83% | 53.82% | 44.99% | 1.19% | 317 | 265 | 7 |
| 12Ok Firehall #4 | 820 | 1 | 2 | 116 | 14.15% | 56.59% | 42.44% | 0.98% | 464 | 348 | 8 |
| 12Wv Wv Baptist | 487 | 1 | 2 | 93 | 19.10% | 58.52% | 39.43% | 2.05% | 285 | 192 | 10 |
| 13P Sull. South HS | 1,770 | 1 | 2 | 441 | 24.92% | 61.81% | 36.89% | 1.30% | 1,094 | 653 | 23 |
| 14Ch Colon. Hgts. Ms | 2,057 | 1 | 2 | 677 | 32.91% | 65.53% | 32.62% | 1.85% | 1,348 | 671 | 38 |
| 14Mp Miller Perry S | 1,440 | 1 | 2 | 459 | 31.87% | 64.93% | 33.06% | 2.01% | 935 | 476 | 29 |
| 15 Sullivan West Ms | 1,006 | 1 | 2 | 137 | 13.62% | 55.96% | 42.35% | 1.69% | 563 | 426 | 17 |
| 16Bc Bluff City Ms | 1,043 | 1 | 2 | 117 | 11.22% | 54.84% | 43.62% | 1.53% | 572 | 455 | 16 |
| 16Cg Chinquapin | 455 | 1 | 2 | 94 | 20.66% | 60.22% | 39.56% | 0.22% | 274 | 180 | 1 |
| 17E Fairmount Sch | 1,139 | 1 | 2 | 48 | 4.21% | 51.19% | 46.97% | 1.84% | 583 | 535 | 21 |
| 17S Haynesfield Sch | 892 | 1 | 2 | 136 | 15.25% | 56.28% | 41.03% | 2.69% | 502 | 366 | 24 |
| 17W Anderson School | 1,346 | 1 | 2 | 189 | 14.04% | 55.94% | 41.90% | 2.15% | 753 | 564 | 29 |
| 18 Holston Mid Sch | 625 | 1 | 2 | 142 | 22.72% | 60.48% | 37.76% | 1.76% | 378 | 236 | 11 |
| 19H E Cherokee Sch | 118 | 1 | 2 | 7 | 5.93% | 50.85% | 44.92% | 4.24% | 60 | 53 | 5 |
| 20 Rocky Spgs. Comm | 577 | 1 | 2 | 134 | 23.22% | 60.66% | 37.44% | 1.91% | 350 | 216 | 11 |
| 21 Weaver School | 852 | 1 | 2 | 162 | 19.01% | 59.15% | 40.14% | 0.70% | 504 | 342 | 6 |
| 22 Holston Valley Ms | 409 | 1 | 2 | 112 | 27.38% | 62.59% | 35.21% | 2.20% | 256 | 144 | 9 |
| Absentee | 1,475 | 1 | 2 | 361 | 24.47% | 61.36% | 36.88% | 1.76% | 905 | 544 | 26 |
| Early | 15,972 | 1 | 2 | 3,759 | 23.53% | 61.21% | 37.67% | 1.12% | 9,776 | 6,017 | 179 |
| Total | 55,727 | 1 | 2 | 12,128 | 21.76% | 60.08% | 38.32% | 1.60% | 33,482 | 21,354 | 891 |
Friday, November 17, 2006
Badger Ballot Breakdown IV
Some more exit poll information coming out of Wisconsin. Much higher turnout among college aged students. Its being theorized that the gay marriage ban (which passed) brought out higher numbers of previously disengaged young voters. The beneficiaries--not only re-elected Governor Jim Doyle, but Democratic candidates for the state legislature. This was especially pronounced in the western part of the state, home to a significant number of colleges. Congressman Ron Kind (WI3), himself, has five branches of the UW system in his district. As I focused on in a previous post, the Democrats picked up two state Senate seats in this area. It goes to show that these ballot measures sometimes have serious unintended consequences.
Thursday, November 16, 2006
House Members Moving Up or Out?
Its quite common for House members to seek either Senate seats or governorships. This year saw 14 House members try to make the leap. In Senate races, 4 Democrats and 2 Republicans mounted campaigns; for governorships, 2 Democrats and 6 Republicans ran. The results:
Senate:
3 Democratic wins (Cardin-MD, Brown-OH, Sanders-VT)
1 Democratic loss (Ford-TN)
2 Republican losses (Kennedy-MN, Harris-FL)
Governor:
1 Democratic win (Strickland-OH)
1 Democratic loss (Davis-FL)
2 Republican wins (Otter-ID, Gibbons-NV)
4 Republican losses (Beauprez-CO, Nussle-IA, Green-WI, Istook-OK)
So, Democrats go 4 for 6, Republicans go 2 for 8.
For House members trying to make this jump, their records inevitably come into play. The thousands of votes they cast become parsed (we see the same thing during presidential races--i.e. Kerry) and, for those Republicans running this year, they got linked to an unpopular president. I know this was definately the case in Wisconsin. While the Governor of Wisconsin has little to say about the war in Iraq, the incumbent Jim Doyle quite successfully used the issue to attack Mark Green.
Using the Presidential Race to Identify Opportunities
Going into a midterm election, one thing each party would do, in trying to identify potential pick-ups, is look at presidential returns. Going into this year, Democrats would look for districts that Kerry carried but that were held by Republicans. Vice versa for Republicans.
Looking at the data, Kerry did not run ahead of a single Republican House member in ’04. Bush, meanwhile, ran ahead of 49 House Democrats. We know that not one of these Democratic seats changed hands. If we were to pick the 20 most “vulnerable” Republicans (including ties) coming into 2006 based on their vote relative to Kerry’s, these members would be targeted:
Member, District, Margin Over Kerry:
Simmons (CT2)--Even
Gerlach (PA6)--Even
Shays (CT4)--Even
Reichert (WA8) +1%
Nussle (IA1) +2%
Beauprez (CO7) +4%
Fitzpatrick (PA8) +4%
Leach (IA2) +4%
Wilson (NM1) +4%
Bass (NH2) +6%
Porter (NV3) +6%
Weldon (PA7) +6%
Thompson (CA1) +7%
Dent (PA15) +9%
Kuhl (NY29) +9%
Northrup (KY1) +9%
Dreier (CA26) +10%
Hyde (IL6) +10%
McCotter (MI11) +10%
Knollenberg (MI9) +10%
Sodrel (IN9) +10%
How did the Democrats do against these Republican incumbents? They picked up 9 (in bold).
Thus, while presidential returns can provide a starting point for parties trying to pick up seats, this year saw a large number of Democratic pickups in places we wouldn’t have expected coming into this cycle. Its been noted that a number of these Republican victims were tainted by scandal (Sherwood, Pombo, DeLay, Ney, Foley, Sweeney). Beyond these more “explainable” defeats, though, there certainly were some surprises (Ryun, Hayworth) that illustrate the degree to which the national or statewide mood can create unlikely victims.
Wednesday, November 15, 2006
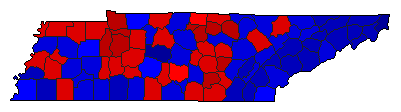
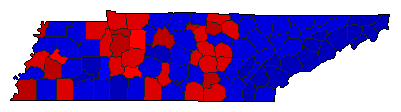
Tennessee Senate Comparison
A lot has been made of Harold Ford's near-victory in Tennessee. I thought it would be useful to see how close, comparatively speaking, he came. Flipping through some returns, I came across the 2002 race in Tennessee. It was similar to 2006 in three main respects--1) midterm election with 2) no incumbent running and the Democratic nominee an 3) incumbent House member. Here are the results:
***Note--Democratic counties in Red; Republican in Blue
2006
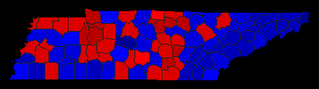
2002
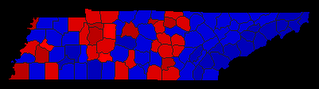
Ford received a higher statwide vote total than 2002 Democratic nominee Bob Clement (48% vs 44%). Clement, on the other hand, won 6 more counties than Ford did. Ford actually did better than Clement in Nashville (Davidson County), which was Clement's back yard--61% vs 56%. Ford did much better than Clement in Memphis (Shelby County), which was his back yard--63% vs 49%.
As we would expect, the more urbanized parts of Tennessee went Democratic, and moreso this year than in 2002. The trick, thus, for Democrats statewide is to find a way to capture more of the rural vote. The fact that there are two Tennessee House Democrats from largely rural areas (Lincoln Davis and John Tanner) shows that it can be done, as does the success of just re-elected Democratic Governor Phil Bredesen.
***Note--Democratic counties in Red; Republican in Blue
2006
2002
Ford received a higher statwide vote total than 2002 Democratic nominee Bob Clement (48% vs 44%). Clement, on the other hand, won 6 more counties than Ford did. Ford actually did better than Clement in Nashville (Davidson County), which was Clement's back yard--61% vs 56%. Ford did much better than Clement in Memphis (Shelby County), which was his back yard--63% vs 49%.
As we would expect, the more urbanized parts of Tennessee went Democratic, and moreso this year than in 2002. The trick, thus, for Democrats statewide is to find a way to capture more of the rural vote. The fact that there are two Tennessee House Democrats from largely rural areas (Lincoln Davis and John Tanner) shows that it can be done, as does the success of just re-elected Democratic Governor Phil Bredesen.
Incumbents' Performance vs. 2004
Looking deeper into the data, we can see more troubling signs for the Republicans coming out of the House elections. For example, lets look at those incumbents who did worse this year.
Compared to 2004:
158 Republicans got a lower percentage of the vote in 2006 than 2004.
70 of these received less than 60% of the vote this time.
39 Democrats got a lower percentage of the vote in 2006 than 2004.
6 of these received less than 60% of the vote this time.
Thus, aside from first term members (who tend to be the most vulnerable), the Democrats have many fewer members who might be vulnerable in '08--at least based on their recent performance.
To give some examples:
Jim Walsh (NY25)--91% to 51%
Mark Souder (IN3)--69% to 54%
Ron Lewis (KY2)--68% to 55%
Mike Castle (DE-AL)--69% to 57%
Deborah Pryce (OH15)--62% to 51%
Mark Kirk (IL10)--64% to 53%
None of these members were vulnerable this year due to scandal. Now it should be noted that oftentimes members recover from a close race and build up their support to previous levels. Challenger quality is also of great importance. And of course, we don't know what the political terrain will look like two years from now. Nonetheless, one can be sure that these members already have targets on their backs for '08.
Next, lets look at those members who did better this year.
Compared to 2004:
37 Republicans got a higher percentage of the vote in 2006 than 2004.
127 Democrats got a higher percentage of the vote in 2006 than 2004.
So--164 incumbents improved their performance; 197 saw their performance decline. Comparing the two cycles, Democratic incumbents vastly outperformed their Republican colleagues.
Compared to 2004:
158 Republicans got a lower percentage of the vote in 2006 than 2004.
70 of these received less than 60% of the vote this time.
39 Democrats got a lower percentage of the vote in 2006 than 2004.
6 of these received less than 60% of the vote this time.
Thus, aside from first term members (who tend to be the most vulnerable), the Democrats have many fewer members who might be vulnerable in '08--at least based on their recent performance.
To give some examples:
Jim Walsh (NY25)--91% to 51%
Mark Souder (IN3)--69% to 54%
Ron Lewis (KY2)--68% to 55%
Mike Castle (DE-AL)--69% to 57%
Deborah Pryce (OH15)--62% to 51%
Mark Kirk (IL10)--64% to 53%
None of these members were vulnerable this year due to scandal. Now it should be noted that oftentimes members recover from a close race and build up their support to previous levels. Challenger quality is also of great importance. And of course, we don't know what the political terrain will look like two years from now. Nonetheless, one can be sure that these members already have targets on their backs for '08.
Next, lets look at those members who did better this year.
Compared to 2004:
37 Republicans got a higher percentage of the vote in 2006 than 2004.
127 Democrats got a higher percentage of the vote in 2006 than 2004.
So--164 incumbents improved their performance; 197 saw their performance decline. Comparing the two cycles, Democratic incumbents vastly outperformed their Republican colleagues.
Tuesday, November 14, 2006
The First Big Number Crunch
Political scientists, especially in response to increased gerrymandering, have been concerned about the declining number of competitive or “marginal” House races. Because of the tremendous advantages that incumbents have in gaining re-election (recent cycles have seen re-election rates in the neighborhood of 95%) it is difficult for either party to gain seats, absent a large number of “open” seats in which no incumbent is running. Thus, leading into this year, many were skeptical of the ability of Democrats to capture the House majority. Now that we know that they did, we can begin to see how.
I’ve defined a “competitive” race as one in which the winning candidate received less than 60% of the vote. This year there were 2 races in which the Democrats picked up a previously held Republican seat by winning greater than 60% of the vote (IN8, OH18). These are clearly the exception to the norm. By focusing on competitive races, not only can we see more clearly whether one party outperformed another—beyond just looking at seats picked up or lost—but we can also begin to set the stage for the 2008 contest. Those races that were competitive in 2006 have the potential to be competitive in 2008, especially with the increased turnout of a presidential election year. So, what do we find?
Overall, there were 128 House races in which the winning candidate received less than 60% of the vote. Of these:
87 were won by Republicans
41 were won by Democrats
Of the 87 Republican wins:
78 were won by incumbents
9 were won by freshman members, all in open seat races previously held by a Republican (CA48, CO5, FL13, ID1, IL6, MI7, MN6, NE3, NV2)
No incumbent Democrat was defeated and no open seat previously held by a Democrat was won by a Republican.
Of the 41 Democratic wins:
11 were won by incumbents
30 were won by freshman members:
22 defeated Republican incumbents
8 won open seats
3 open seats were previously held by Democrats (IL17, MN5, VT- AL)
5 open seats were previously held by Republicans (AZ8, CO7, IA1, NY24, WI8)
What these numbers clearly show is that things could have been a whole lot worse for the Republicans. They won a tremendous number of close races and were able to mount a challenge to only a few Democratic incumbents. Only 6 of the Democratic incumbents got less than 55% (Barrow, Marshall, Bean, Boswell, Carson, Hooley).
Coming up---How did this year compare to 2004??
2006 vs. 2004 House Races

Here we see the change in the Republican vote across House districts between 2006 and 2004. The big shift, obviously, was in the northeast.
***Maps courtesy of DailyKos
Was It a Wave?
Here's an article that begins to delve into the data regarding the magnitude of the Democratic surge. The Democratic share of the vote, across races, was higher than it was for Republicans in 1994. I'm putting together some data now--that I should be ready to post in a day or so--that looks at incumbents' share of the vote over the past 2 cycles. What will be of interest is how many incumbents (and from where) saw their share of the vote go down substantially. We know of the incumbent defeats. We'll focus on the close calls--and therefore the potential targets for '08.
Sunday, November 12, 2006
Kansas Backlash?
The results in Kansas are quite interesting. The race that has gotten the most attention was the defeat of Jim Ryun. In this race, a rematch of 2004, Nancy Boyda picked up 10 points (2004--41%; 2006--51%). What needs to be explored more is the context that might have allowed this outcome to occur. Beyond Kathleen Sibelius winning re-election by a large margin, a number of former Republicans ran as Democrats in down-ballot races, including Lieutenant Governor and Attorney General. Both won in part by campaigning against the far right drift of the Kansas Republican party over the past decade or so. This article goes into this dynamic, focusing on the AG race. Whether is purging of the Republican ranks of moderates in Kansas is permanent remains to be seen but for Democrats trying to make inroads into the plains states, its certainly a positive sign.
What we can say about this, as of now, is that Republicans seemed to have stayed home in Kansas. Republican turnout was down 10.5% versus 2002, and turnout overall declined by slightly over 1%. So it doesn't seem like there's a wholescale movement to the Democrats. We just had a different electorate show up.
What we can say about this, as of now, is that Republicans seemed to have stayed home in Kansas. Republican turnout was down 10.5% versus 2002, and turnout overall declined by slightly over 1%. So it doesn't seem like there's a wholescale movement to the Democrats. We just had a different electorate show up.
Friday, November 10, 2006
Who Turned Out???
Lots of turnout data now becoming available. Biggest increase in turnout compared to 2002---Virginia.
Badger Ballot Breakdown III


One thing that I've always argued is that if you want to understand the success of Democrats in Wisconsin, you can't just focus on Milwaukee and Madison. While this is obviously where the most votes are and where Dems run up their margins, I would argue that it is the western part of the state that tells the true story of Democratic state wide success. On Tuesday the Democrats recaptured the state senate, in part by picking up two seats near Eau Claire (the 23rd and 31st).
If you compare these maps with the map showing the governor's results (earlier post), you can see how western Wisconsin is pretty consistently Democratic. It has three Democratic House members (Obey, Kind, Baldwin) and has voted Democratic in the past several presidential elections (Gore in particular can thank this area for his 2000 win in Wisconsin). While the area is heavily rural, there is still very much a Progressive pulse that runs throughout the region.
Badger Ballot Breakdown II
Here is the exit polling for Wisconsin as reported by CNN. Not much seems to differ from what's been reported about the mood nationwide. In summary:
Doyle got 59% of the self-described "Independent" vote and 51% of the Catholic vote (a big piece of the Wisconsin electorate).
As to the saliency of the war in Iraq, there was an overall 58% disapproval (37% strong disapproval) of the war. Doyle received 85% of this vote. 68% said the war is either "very" or "extremely" important to their vote. I will say that its hard to really gauge the true weight of this issue because the polling doesn't compare Iraq with other issues and come up with a ranking of importance.
There's also been some discussion about the role of Wisconsin's two referenda on the outcome of the governor's race. College towns had big increases in turnout to oppose the gay marriage ban. Doyle was the obvious beneficiary.
Thursday, November 09, 2006
The Blue Suburbs--Virginia Style
Here are the final numbers for the Webb/Allen Senate race in Virginia--Fairfax, Loudon, and Prince William counties. Obviously this is where the race was won, but it really underscores the historical change that we've been seeing in the suburban vote over the last few years. The difference between 2000 and 2006--where Allen defeated incumbent Dem. Senator Chuck Robb is pretty amazing (Fairfax, Loudon, Prince William).
Badger Ballot Breakdown I

Here is a map showing the county by county vote totals for Wisconsin's governor's race. While the re-election of incumbent Jim Doyle (D) was not so much of a surprise, one thing jumped out at me.
The challenger in the race was Congressman Mark Green. His House district is essentially the northeastern corner of the state, centered around Green Bay. For any Republican running statewide in Wisconsin, you begin your campaign knowing that you are going to lose in Milwaukee and Madison (Dane County). The western part of the state (Eau Claire and La Crosse counties especially) have been pretty solidly Democratic over the years but competitive. Where Republicans really make their hay is in the corridor of counties extending north from Milwaukee up to Green Bay. My home county (Fond du Lac) is the second most Republican in the state. The center of Republican votes is Fond du Lac, Winnebago (Oshkosh), Outagamie (Appleton), and Brown (Green Bay).
Because this area also includes Green's congressional district (Brown and Outagamie) you would have expected him to clean up here. In fact, he didn't, and that's what is so interesting. In Brown county, Doyle and Green were essentially tied, and Doyle won small majorities in Outagamie and Winnebago. Why, I'm not so sure yet but this article might get at some of it.
Not only did the high independent turn-out seem to help Doyle, but I'm intrigued by the relationship between the governor's race and the open seat House race to succeed Green. Normally a strong Republican district, the Democratic candidate Steve Kagan managed to pick it up by defeating Wisconsin Assembly Speaker John Gard. Kagan, a largely self-funded candidate (physician) with no elected experience ran on a message of health care and getting out of Iraq. If the war message really resonated, he may have helped Doyle (who also ran ads linking Green to Bush). More to come as I get the Kagen/Gard numbers.
***Note that on the map pictured Red counties voted Democratic, Blue voted Republican--US Election Atlas uses that color scheme
Wednesday, November 08, 2006
And So We Begin
While there are still several races still to be called, some things are becoming clear, while others are still very murky. The goal of this blog is to sort all of this out.
Tentatively, a few things stand out. Looking to the new Congress, the Republican membership, as a whole, becomes much more conservative. The Democratic majority was by and large built by defeating what few Republican moderates were left--Nancy Johnson, Clay Shaw, Jim Leach. With DeWine and Chafee falling in the Senate, I find it hard to see this as a liberal surge. Democratic victors were largely of the Blue Dog type and will, in my mind, be the fulcrum of the 110th Congress.
Looking across the map, there seem to be a lot of things going on and I'm hesitant to ascribe a "meaning" to this election as of yet. Are the Democratic gains in the northeast explained by the same factors as the events in Indiana? Democrats have picked up two House seats in Florida, Iowa, and Arizona. I'm not sure what connects these.
One thing that may give credence to the "nationalization" argument is that it appears, as of now, that 6 incumbent senators have gone down to defeat. That doesn't just happen by accident, and its probably a result of more than just 6 good Democratic candidates running good races with ample funding.
And so, the analysis will continue...
Subscribe to:
Comments (Atom)
